Pharmaceutical companies spend millions on primary market research (PMR) every year — and often walk away with the wrong answer. PMR plays a genuine role in the R&D process: interviews with physicians provide insight into treatment paradigms, patient types and “journeys,” and reasonable expectations for the future of a disease. Equinox Group routinely conducts such interviews to inform our modeling efforts. This type of research has been a staple in the industry for decades, making it something people at all levels of organizations understand and can use to extract actionable insights. So, what’s the problem?
Too often, PMR is asked to be something it is not: a replacement for rigorous techniques that can quantify the advantage of a particular drug over another and communicate how that advantage actually translates to patient share potential. Below, we examine the specific instances where PMR comes up short and explain the approaches we take at Equinox Group to overcome these deficiencies.
1. Primary market research is not dynamic
Given that PMR consists of semi-quantitative interviews, much of the content of these interviews is only applicable so long as important details such as the treatment paradigm, current clinical data, and competitive pipeline remain unchanged. For example, if new post-approval data that come out show a drug to be a much greater improvement over the standard of care than previously thought, such as in the case of Kisqali in HER2-, HR+ 1st line breast cancer, any PMR done involving the current treatment paradigm and efficacy in this population prior to the new data being read out would immediately become outdated and of little use to development teams. So, if a company wants new insights into the potential of their drug in the market, they have no choice but to commit more time and money to additional PMR.
At Equinox Group, we handle this problem by creating dynamic, data-driven models that can instantly deliver new outputs with a few clicks of a button. Any clinical data, launch date, competitor, or price of an agent can be updated in our models as soon as that new information is available, resulting in a new patient share prediction for your agent.
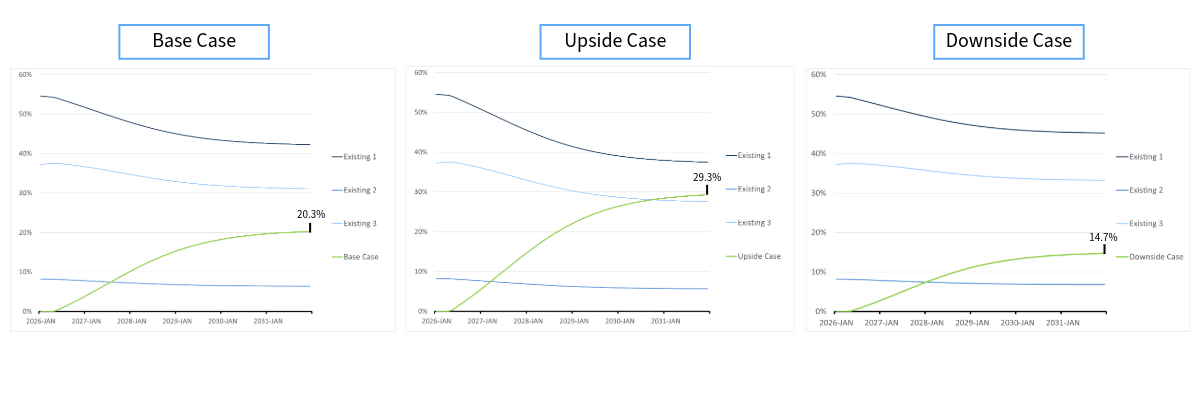
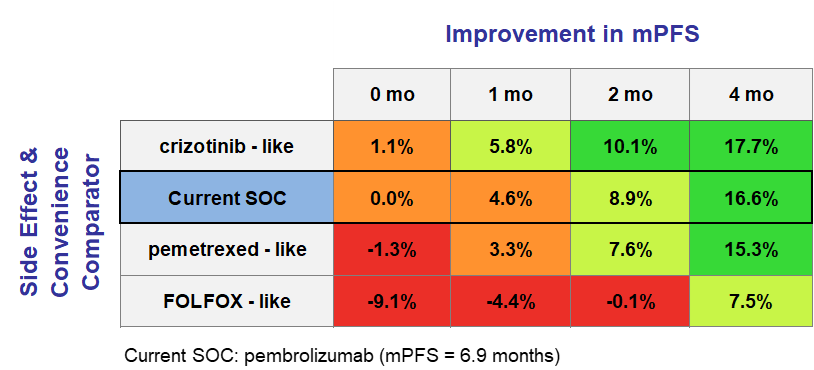
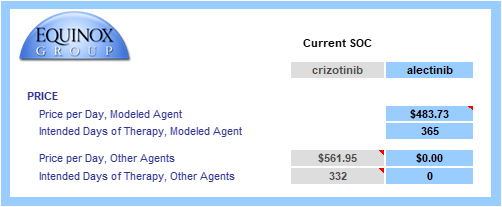
Consider the Kisqali example. At launch, Kisqali showed a mere 0.5% improvement over Ibrance — barely enough to move the needle — and initial sales reflected that.
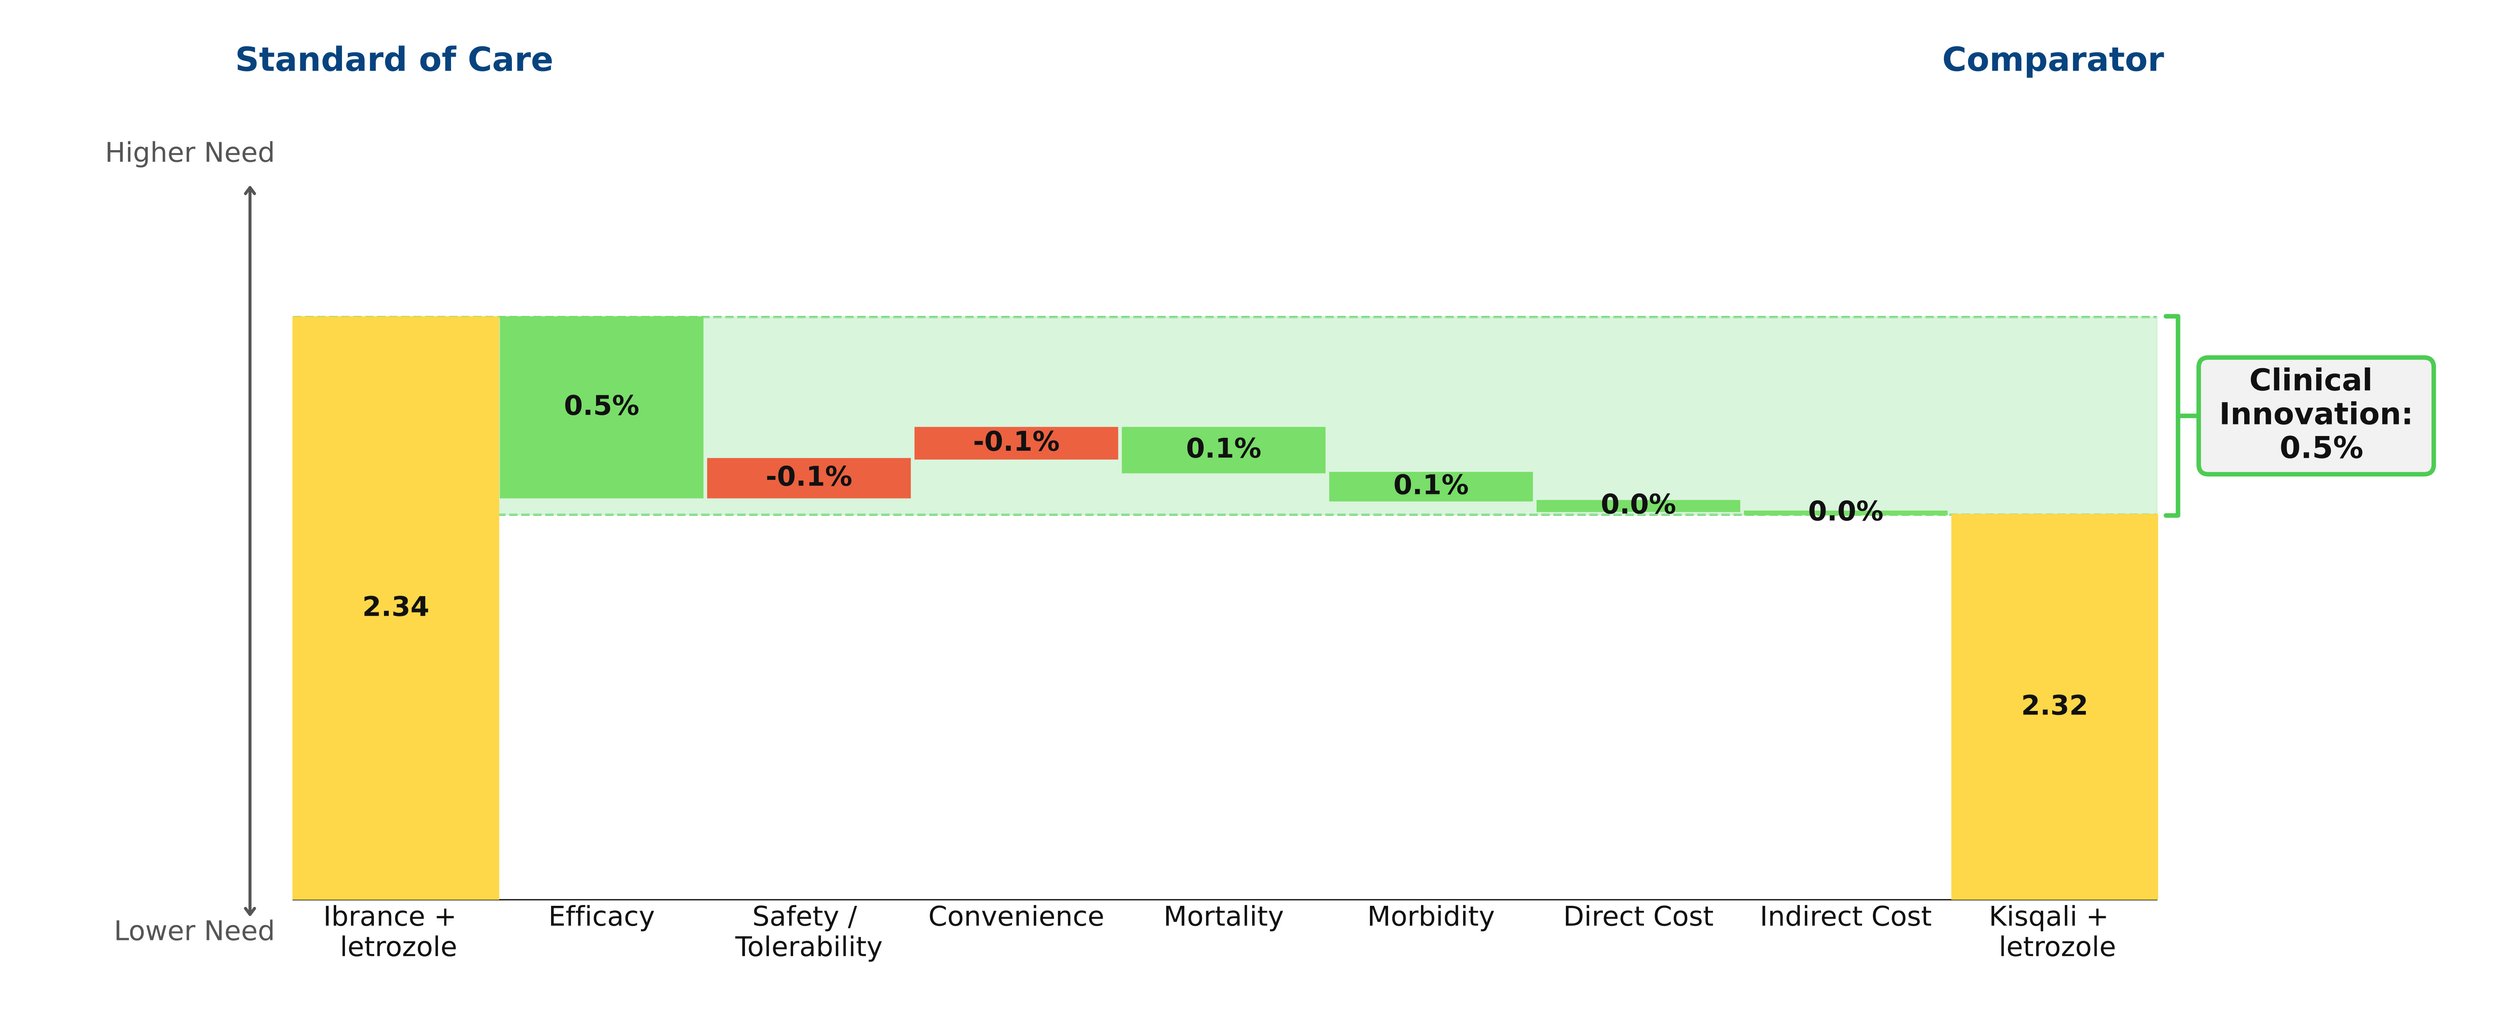
Figure 1: Kisqali at launch
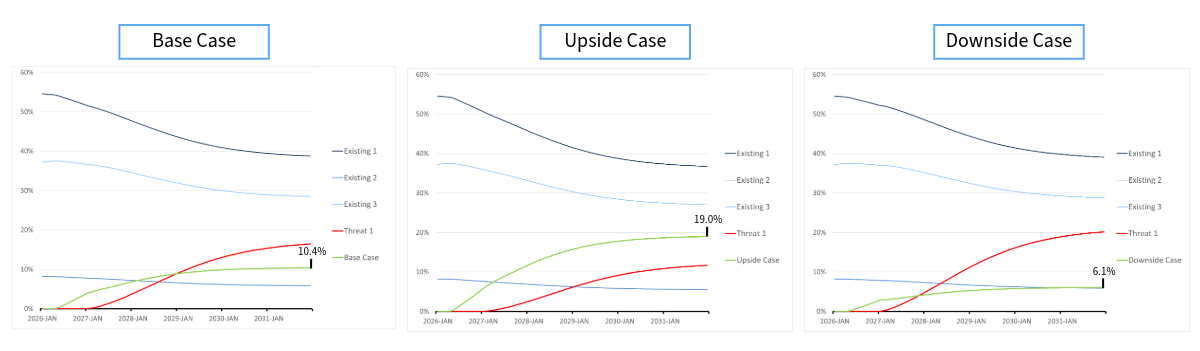
However, years later Ibrance was found to have disappointing survival data, proving it to have been far less efficacious than previously thought. A slight improvement in efficacy for Kisqali was also shown over this period. As a result, Kisqali actually proved to be far superior to Ibrance and that was reflected in the patient share that it ended up receiving.
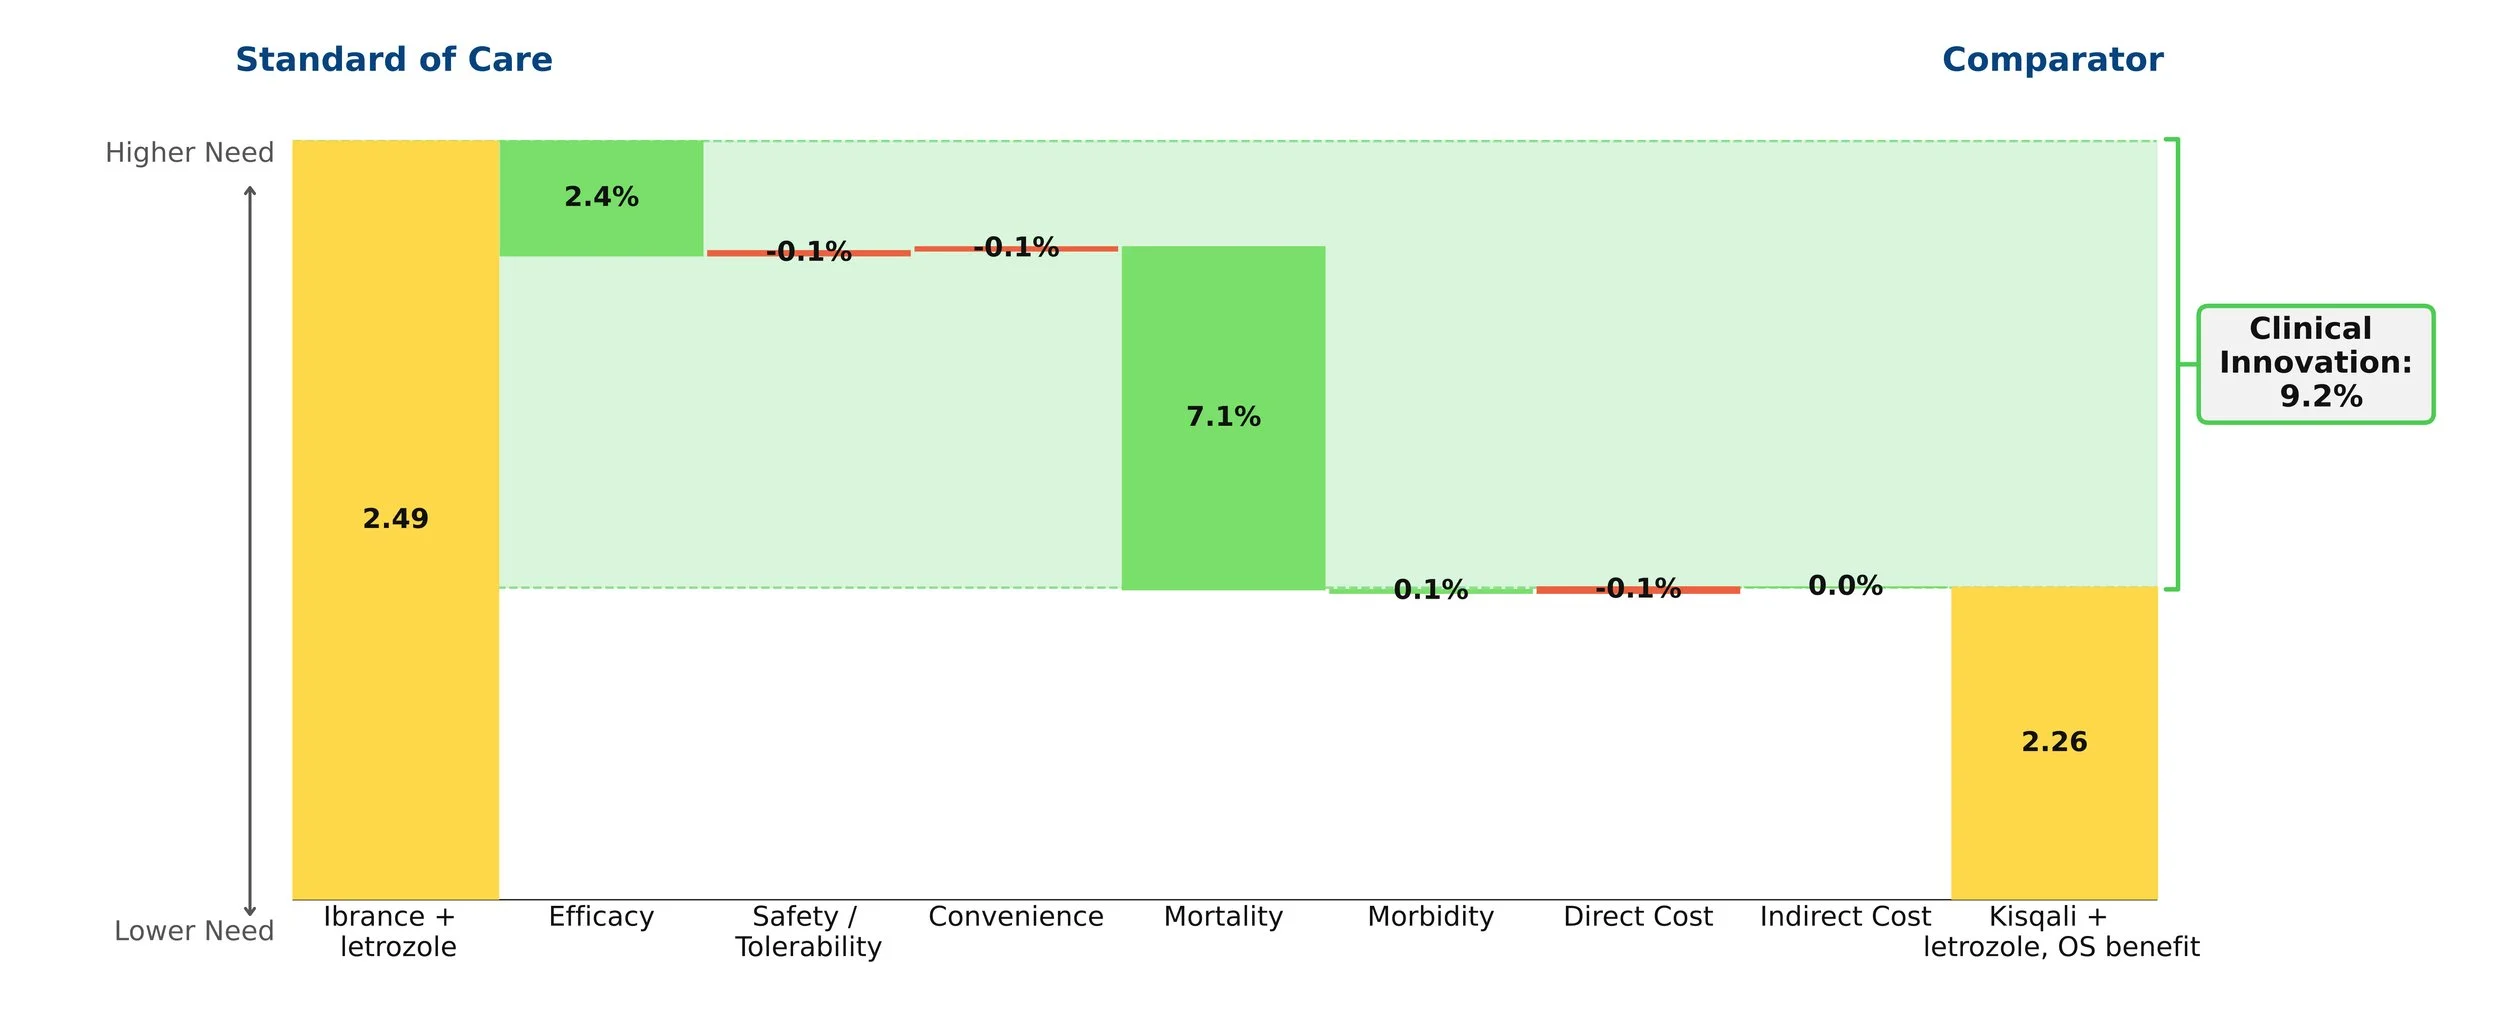
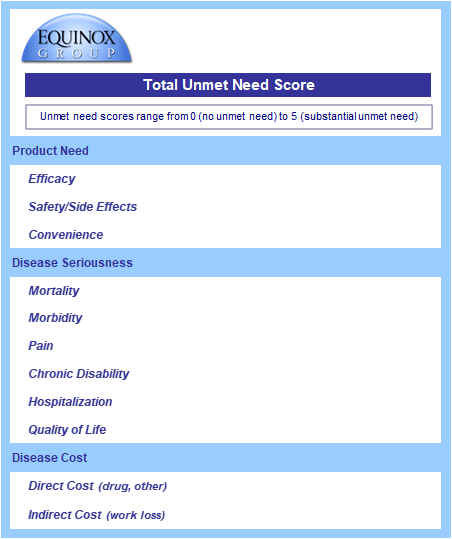
Figure 2: Kisqali update
In our model, this shift was captured instantaneously by updating a handful of numbers — a process that took seconds, not months at no additional cost.
2. Primary market research is not unbiased empirical data
As noted above, PMR is effective in obtaining insights from physicians regarding a variety of topics. However, these insights remain opinions — capable of being influenced by personal biases — and do not reach the level of objectivity of empirical clinical evidence. This is especially true in longer interviews, where respondents become fatigued and the quality of their answers deteriorates. Framing effects compound this problem: the way an interview is structured can meaningfully shift the responses given. While exercises such as conjoint analysis can yield a rough estimate of how one additional month of mPFS or a cleaner side effect profile affects commercial success, this method is not optimal.
As a core principle, the qualitative should only be used to predict the qualitative, while the quantitative should predict the quantitative. Results from PMR can suggest whether a drug will obtain “significant” share and dominate the market, but they cannot reliably pinpoint what that share would be.
By looking at historical drug launches and quantifying the effect of the clinical innovation of a drug on its patient share potential, we have a way of discovering the impact of these factors on commercial outcomes strictly based on peer-reviewed clinical data without the need for any guesswork or opinion.
3. Preference share ≠ patient share
While the outcomes of conjoint analyses are not without their uses, at times they are misinterpreted. Perhaps the most important of these outcomes is preference share – an estimate of the percent of physician’s that would choose a given TPP among the profiles of all relevant drugs in the market. Assuming that the interviews are conducted in a way that minimizes bias, the insights gained regarding the relative strengths of TPPs are actually of great value. However, they cannot be used as a proxy for patient share. This is in large part due to the fact that these interviews are incapable of capturing the intricate market dynamics that contribute to a drug’s share. Furthermore, the TPPs that are being assessed lack the necessary detail and often do not consider important factors such as order of entry or price. Therefore, just because we can obtain an estimate for what percent of prescribers favor TPP A over TPP B, it does not necessarily mean that we can know what share either of these agents will obtain. It is also important to note that the subjects of these interviews are, at times, not a nationally representative sample of prescribers.
We avoid these issues by deriving our patient share projections from a consistent, analytical framework that weights clinical innovation (which includes price), order of entry, and competitive environment according to the results of our extensive work with historical drug launches.
4. Primary market research is expensive and labor intensive
Finally, PMR projects often take months and impose large costs upon biopharmaceutical companies. As mentioned above, these costs may compound as new information makes additional research necessary.
In comparison, Equinox Group’s models can be completed in as little as 6 weeks and include two years of after-sales service from the project start date. Because our models are driven by published clinical data rather than primary fieldwork, they can be updated in real time by the client as new information becomes available — without incurring additional research costs every time the market shifts.
If you’d like to see more about this framework, we’d be glad to walk you through a live example. Feel free to schedule a meeting.
Since 1995, Equinox Group has provided analytics to support R&D decisions at biopharmaceutical firms, assessing the potential of drugs from discovery to launch, and anywhere in between. Equinox Group specializes in predicting the commercial performance of drug programs in all stages of research and development, delivering quantitative insights regarding:
Disease Area Strategy
Business Development Decisions
Market Access
Patient Share Forecasting
Epidemiology and Patient Flow