

R&D leaders making investment decisions must rely on opportunity assessments from program advocates. Equinox Group offers independent analyses that allow decision makers to add an objective perspective to these discussions, leading to a fact-based conversation about the clinical and commercial merit of the various projects competing for R&D resources.
“But I don’t have TPPs, what can I do?”
We spend much of our time talking with clients about how good their TPPs look and what patient shares they can expect to achieve in order to guide indication prioritization. To read a case-study on how we do this, click here.
But what can we do for you if you don’t have TPPs yet?
The answer is a two-step process, which we call Disease Area Scan. First, we characterize the unmet medical need, epidemiology, and competitive intensity in all of the populations of interest. This allows for cross-indication comparisons that help identify which opportunities offer the greatest potential for commercial success. Next, we examine each of those opportunities individually, discovering what level of improvement is required in specific product attributes in order to achieve a certain level of Clinical Innovation and peak-year patient share. These analyses are grounded in peer-reviewed literature and hard clinical data, removing subjectivity and opinions from the equation.
Step 1: Characterizing unmet medical need, epidemiology, and competitive intensity
We begin our modeling process by diving into the most recent peer-reviewed literature pertaining to each indication, quantifying the level of unmet need under the current standard of care. See Figure 1 for a detailed breakdown of what we measure.
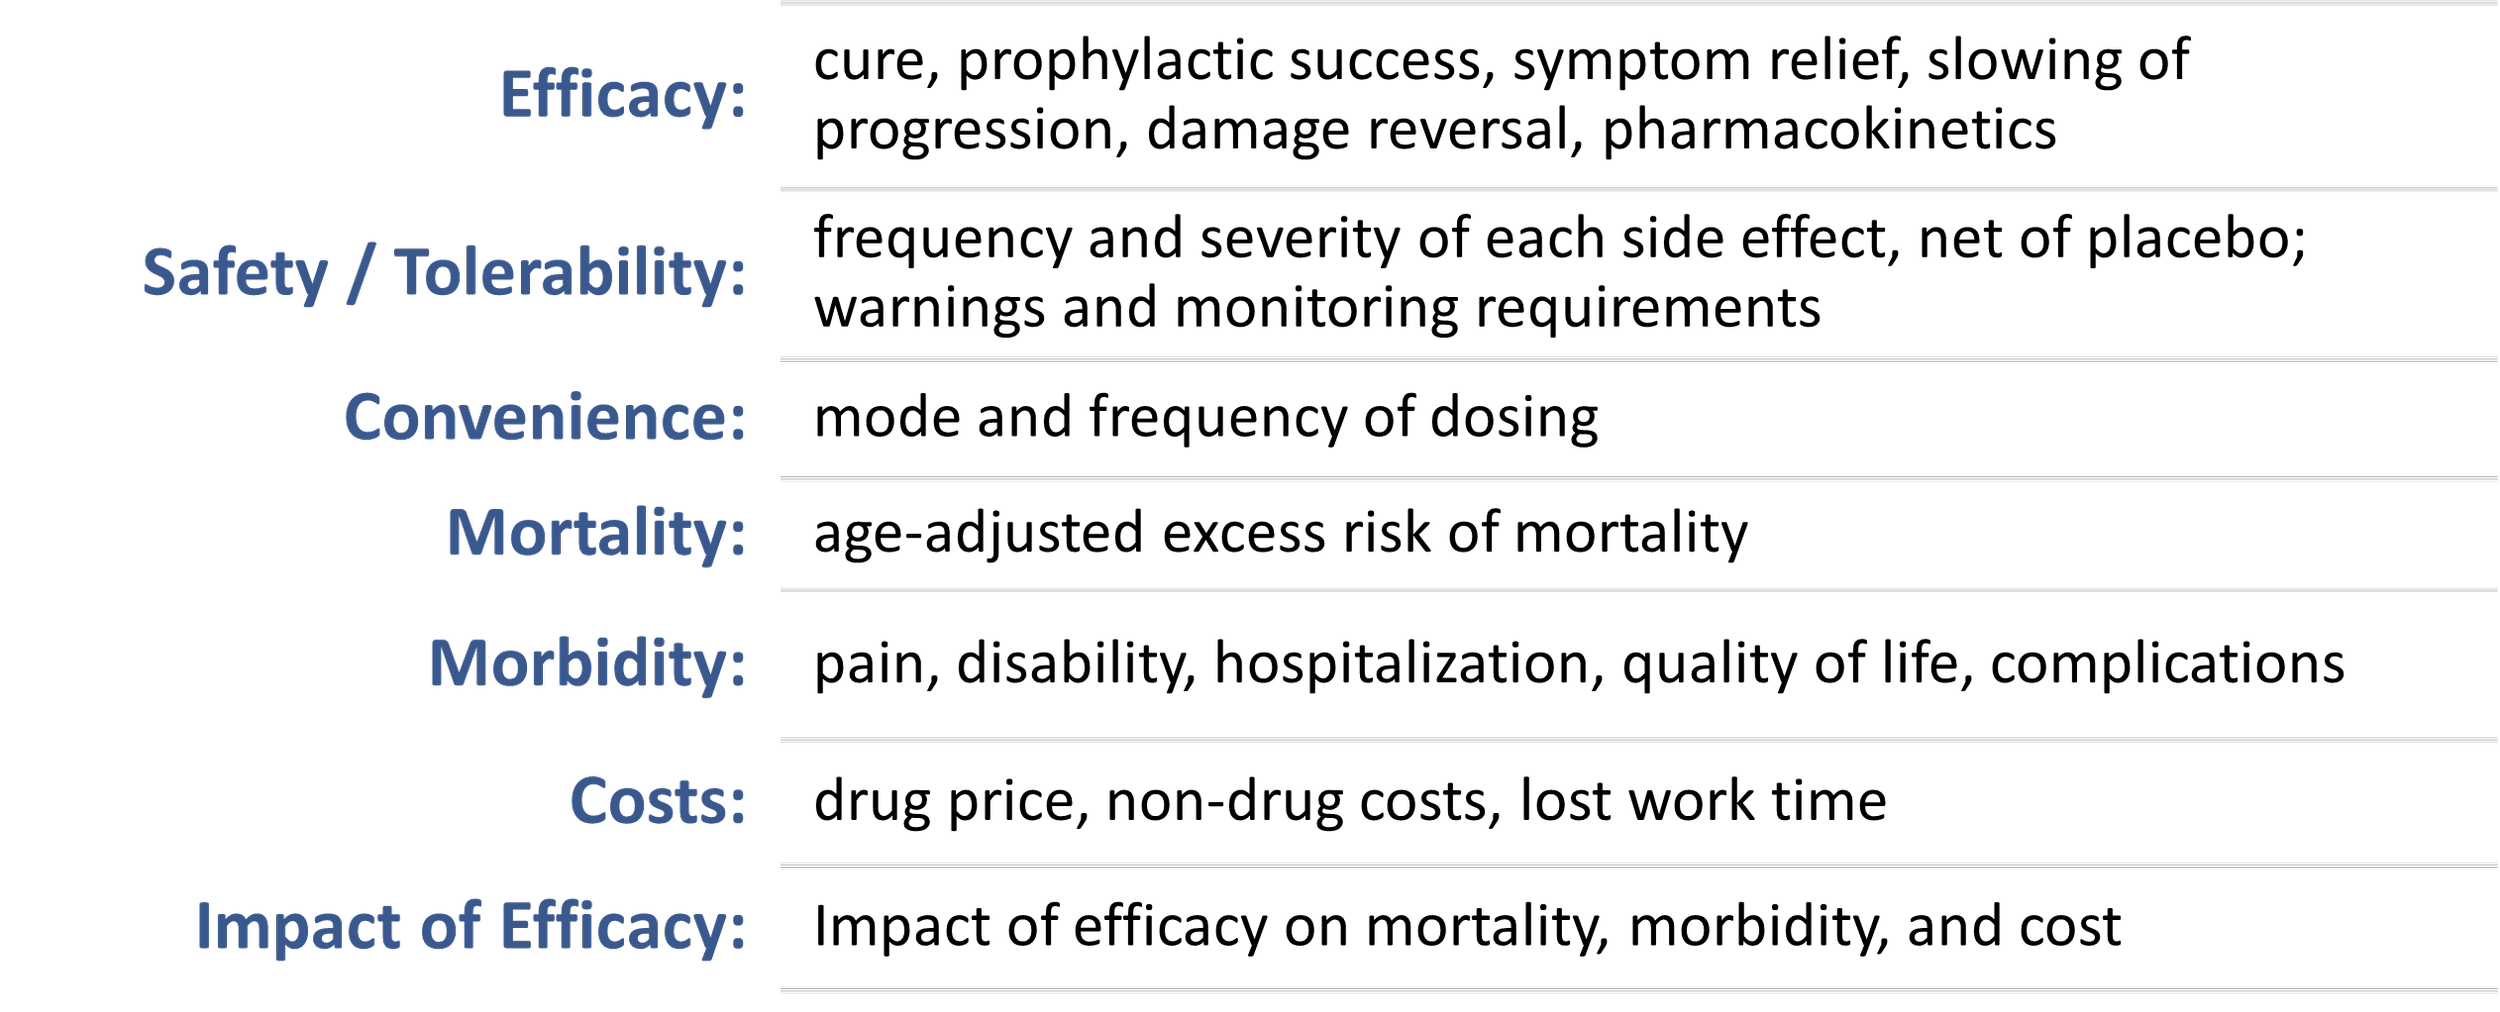
Figure 1: Factors we assess
These measures are then mapped onto a 0 to 5 scale to produce a single “unmet need score,” with a higher score indicating a higher level of unmet medical need.
Next, we align with the client organization on the epidemiology and competitive pipelines in each indication. We represent the latter by a probability weighted score indicating the expected number of head-to-head competitors that a drug will face at launch. We call this the “competitive intensity.”
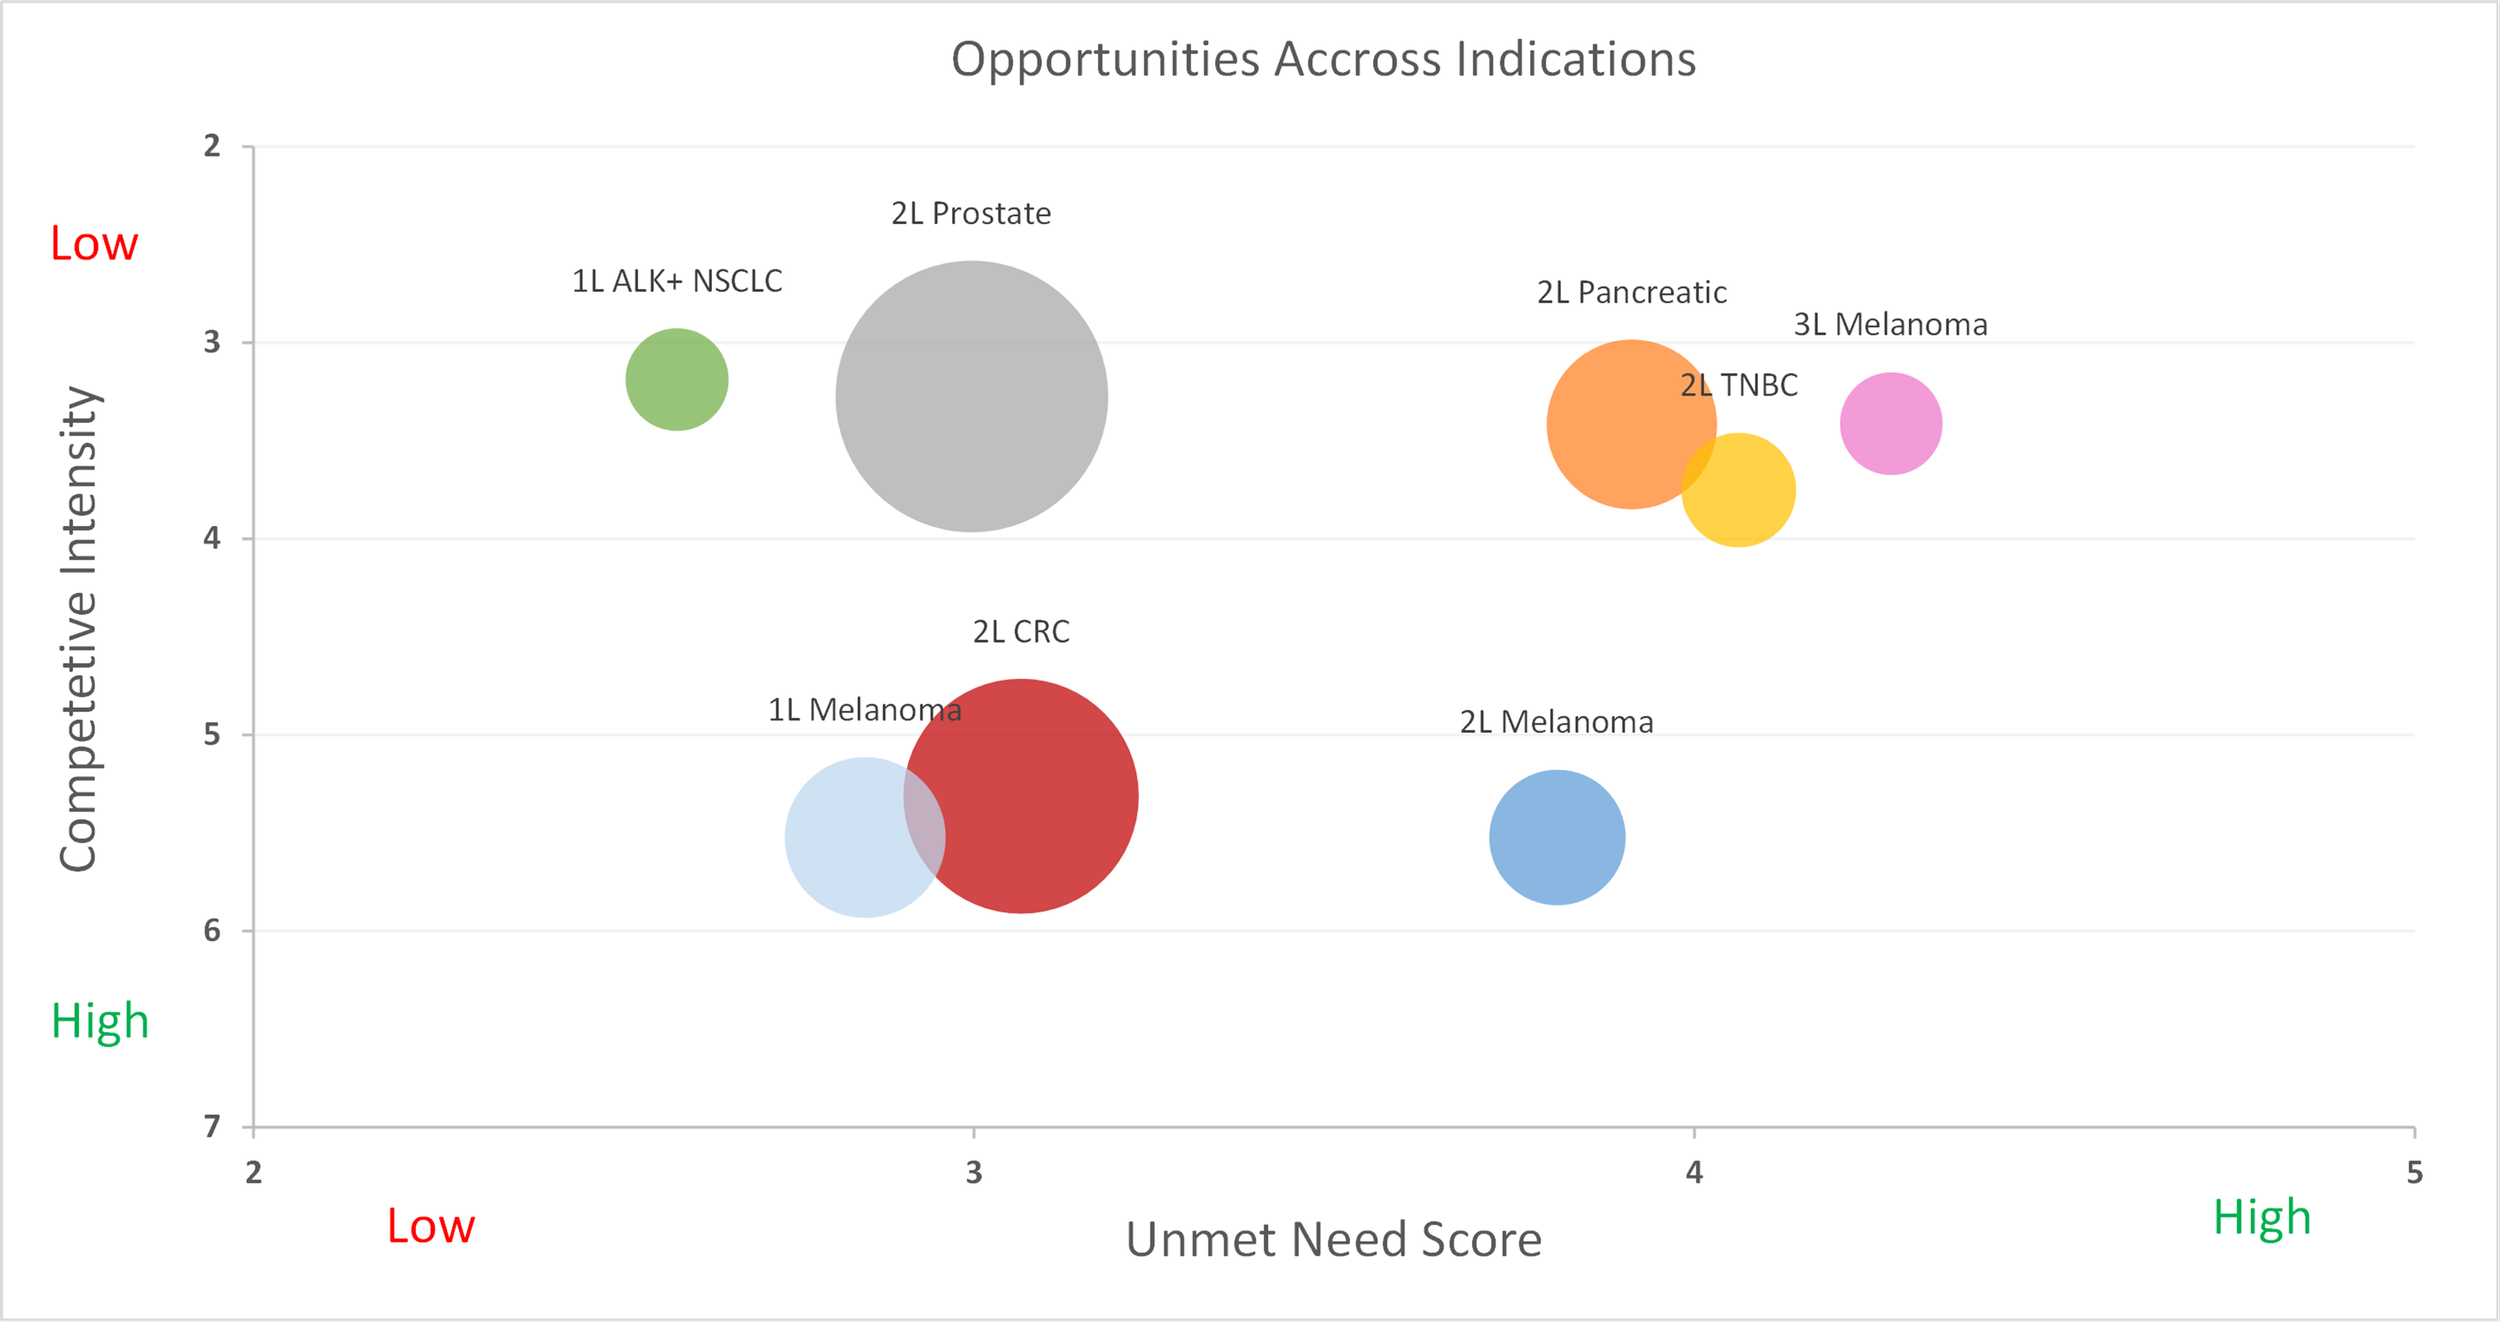
Figure 2: Competitive intensity vs. unmet medical need
Looking at Figure 2, we can identify the most attractive opportunities, which are those with sizeable populations, considerable unmet need, and relatively low competition. Granted, two questions still remain. First, how would the specific drug need to perform in these populations in order to be successful? Second, in what indications do you realistically believe that you can achieve that performance?
Step 2: Using Heat Maps
In order to answer these questions, we can turn to a series of heatmaps, which guide development teams in understanding what levels of Clinical Innovation are achieved by specific efficacy and side effect profiles. Below in Figure 3, we will explore a situation where the current standard of care is pembrolizumab with a median progression-free survival of 6.9 months. We see that an improvement of 1 month in mPFS and a similar side effect profile will result in a 4.6% Clinical Innovation, which is slightly below the recommended 5% threshold. However, if the new drug also offered a side effect profile similar to that of crizotinib, it will achieve a 5.8% Clinical Innovation and likely have a favorable commercial outlook. (For this analysis, it was assumed that an improvement of one month in mPFS also led to an improvement of two months in mOS)
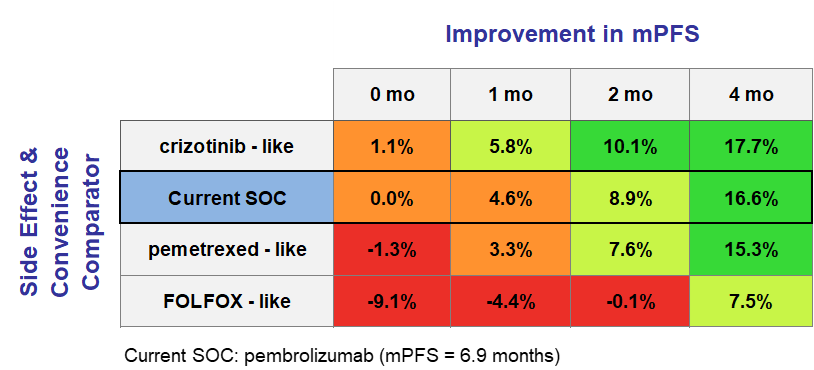
Figure 3: An introduction to heat maps
By focusing on relative improvements under the Equinox framework, development teams are able to identify indications where their agent has the potential to be competitive (those where Clinical Innovation 5-10%) and those where it could be a homerun (Clinical Innovation >10%). In situations where the clinical team is not ready to commit to specific efficacy values for their TPPs, this approach allows teams to prioritize those indications where they are more confident of “getting into the green”. These heat maps can be generated for a variety of attributes, allowing for a comprehensive and thorough analysis of potential products that projects a variety of scenarios.
What About Share Potential?
While Clinical Innovation is a powerful predictor in itself, we don’t have to stop there. Combining the clinical innovation scores of hypothetical TPPs along with the corresponding competitive environment, unmet need, and epidemiology allows for the preliminary estimation of peak-year patient share using our Disease Target Assessment (DTA) framework. Given its dynamic nature, it is easy to conduct “what if” analyses with a variety of TPPs in each indication. Additionally, once TPPs are finalized, they are easily input into the model and adapted to continue to guide the R&D process. To read more about what is behind our analysis and how it predicts share, watch this quick video.
Equinox Group has fine-tuned these methodologies and others over the past 30 years to help biopharmaceutical companies handle challenges in R&D. Our specialties range from market access and go/no-go decisions to patient share forecasting and patient flow modeling.
To learn more about our process, click here to schedule a meeting with one of our practice leaders.


