Gilead’s Trodelvy has made a name for itself in breast cancer, but recently Daiichi Sankyo AstraZeneca’s competing TROP2 ADC, Datroway, has beaten Trodelvy to market in 1L TNBC, a patient segment with traditionally no treatment options aside from chemotherapy alone. Approved one month apart from each other, Datroway has the stronger data, but Trodelvy has a broader label and physician experience on its side.
Approval Histories
In April 2020, Immunomedics’ novel TROP2 ADC, Trodelvy (sacituzumab govitecan-hziy), was granted accelerated approval for the treatment of relapsed or refractory triple-negative breast cancer (R/R TNBC), making it the first ADC approved by the FDA for this indication. Gilead went on to acquire Immunomedics and Trodelvy six months after its initial approval. Trodelvy was granted full approval in R/R TNBC in April 2021 and accelerated approval in pre-treated HR+/HER2- metastatic breast cancer in February 2023. Along the way, Gilead picked up and subsequently voluntarily withdrew an accelerated approval for the ADC in metastatic urothelial cancer.
No new TROP2 ADC had been approved since Trodelvy until January 2025, when Daiichi Sankyo and AstraZeneca’s Datroway (datopotamab deruxtecan-dlnk) was approved in pre-treated HR+/HER2- metastatic breast cancer, almost two years after Trodelvy’s approval in this indication. Datroway’s next approval came in June 2025 for pre-treated EGFR-mutated non-small cell lung cancer (NSCLC), an accelerated approval based on response rates from a pooled subgroup analysis of a broader population, beating Trodelvy to launch in lung cancer.
Clinical Data Summary
Now, within just one month of each other, the two TROP2 ADCs have each gained approval in previously-untreated TNBC, a patient population which to date has had chemotherapy as their only option in immunotherapy (IO)-ineligible patients. Datroway was first to be approved in 1L TNBC ineligible for IO, boasting an impressive 43% reduction in disease progression or death (PFS HR 0.57, p<0.0001) and 21% reduction in mortality, statistically significant at the 5% threshold (OS HR 0.79, p 0.0290) [1]. Trodelvy, just one month later, received approval regardless of a patient’s PD-L1 status, a broader population than that of Datroway. Trodelvy’s overall survival data are immature across both of its 1L TNBC populations, but its PFS benefits are still significant. In the PD-L1-negative/IO-ineligible segment, Trodelvy reduced the risk of disease progression or death by 38% (PFS HR 0.62, p<0.001)[2] compared to Datroway’s 43% reduction. For patients with a PD-L1 combined positive score (CPS) ≥ 10, Trodelvy + Merck’s Keytruda (pembrolizumab) boast a PFS HR = 0.65 (p<0.001) when compared to Keytruda + chemotherapy [3].
Equinox Group’s Analysis
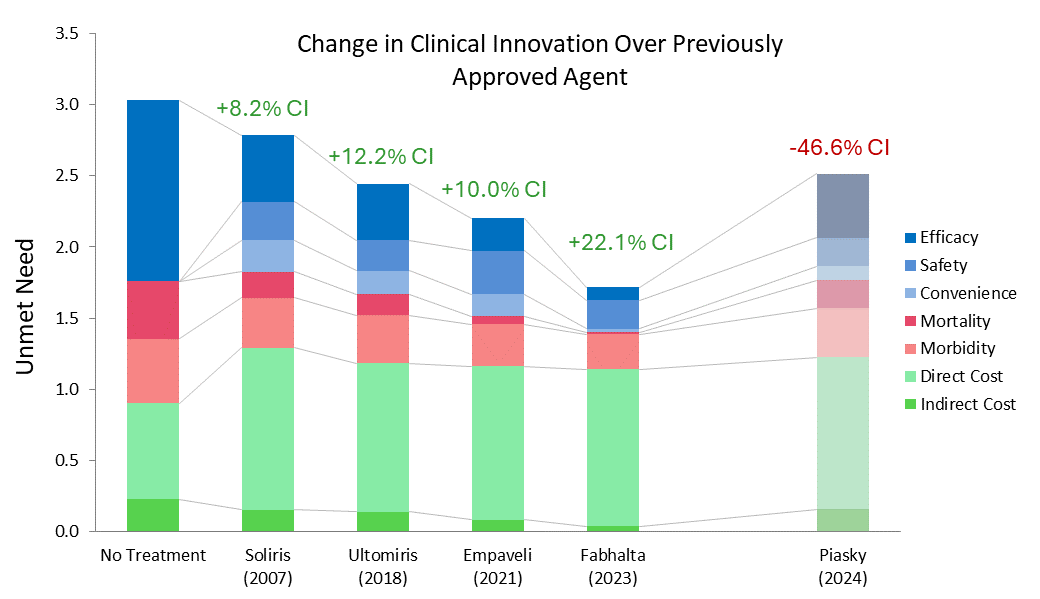
Compared to their respective control arms in the IO-ineligible population, Datroway looks highly innovative using Equinox Group’s Disease Target Assessment (DTA) framework, reducing medical need by 10.6%; historically, improvements ≥10% become leaders in their market segments.
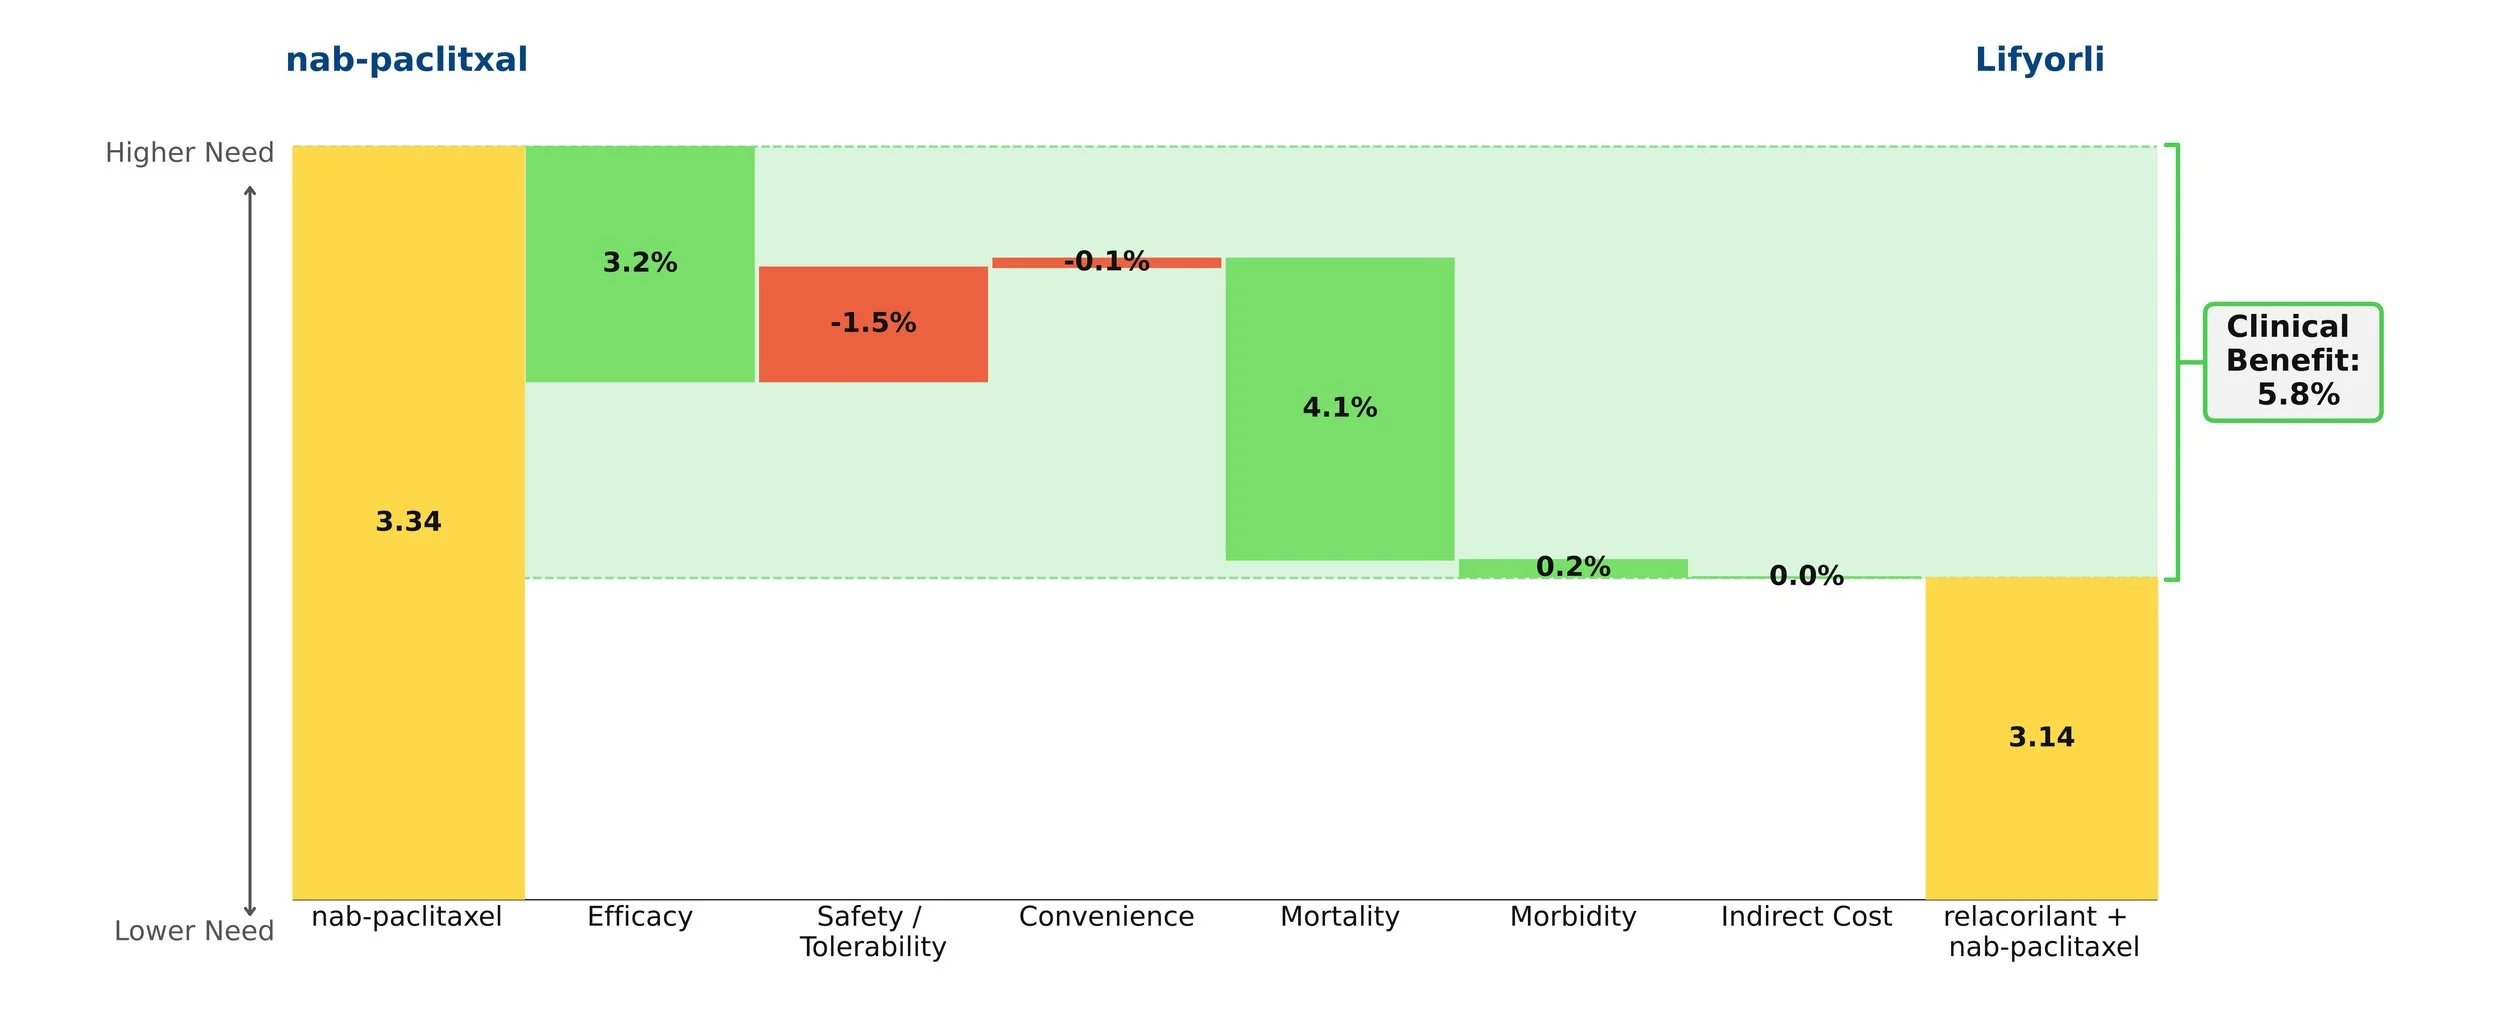
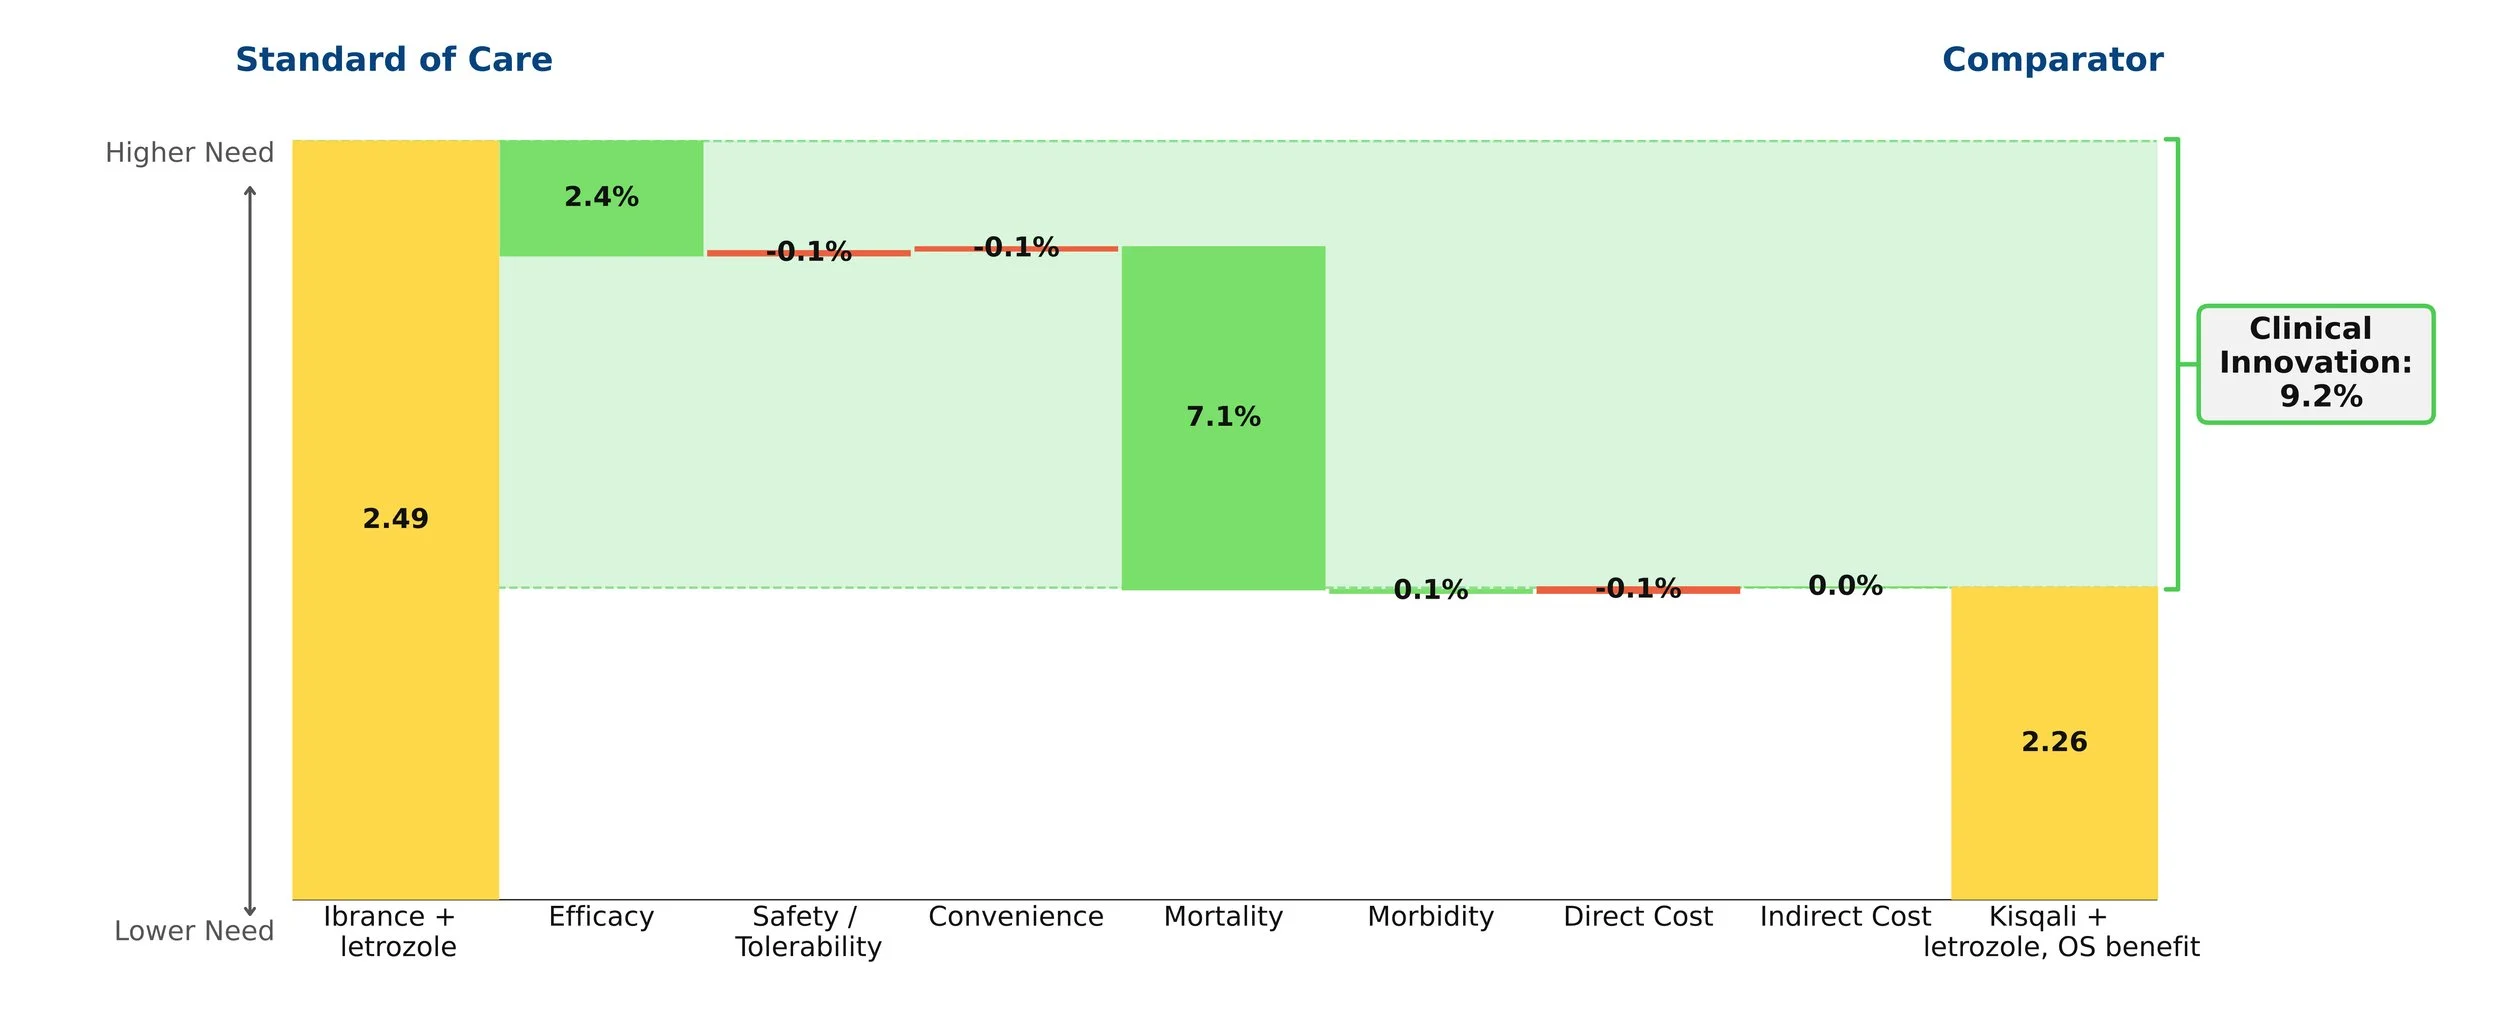
Clinical Innovation is displayed graphically in the below waterfall chart, where the unmet need score of the comparator regimen (chemotherapy) is represented on the left and the entrant (Datroway) on the right. Unmet need is scored on a 0-5 scale, with lower scores representing less unmet medical need. The individual green and red bars total to a regimen’s Clinical Innovation score.
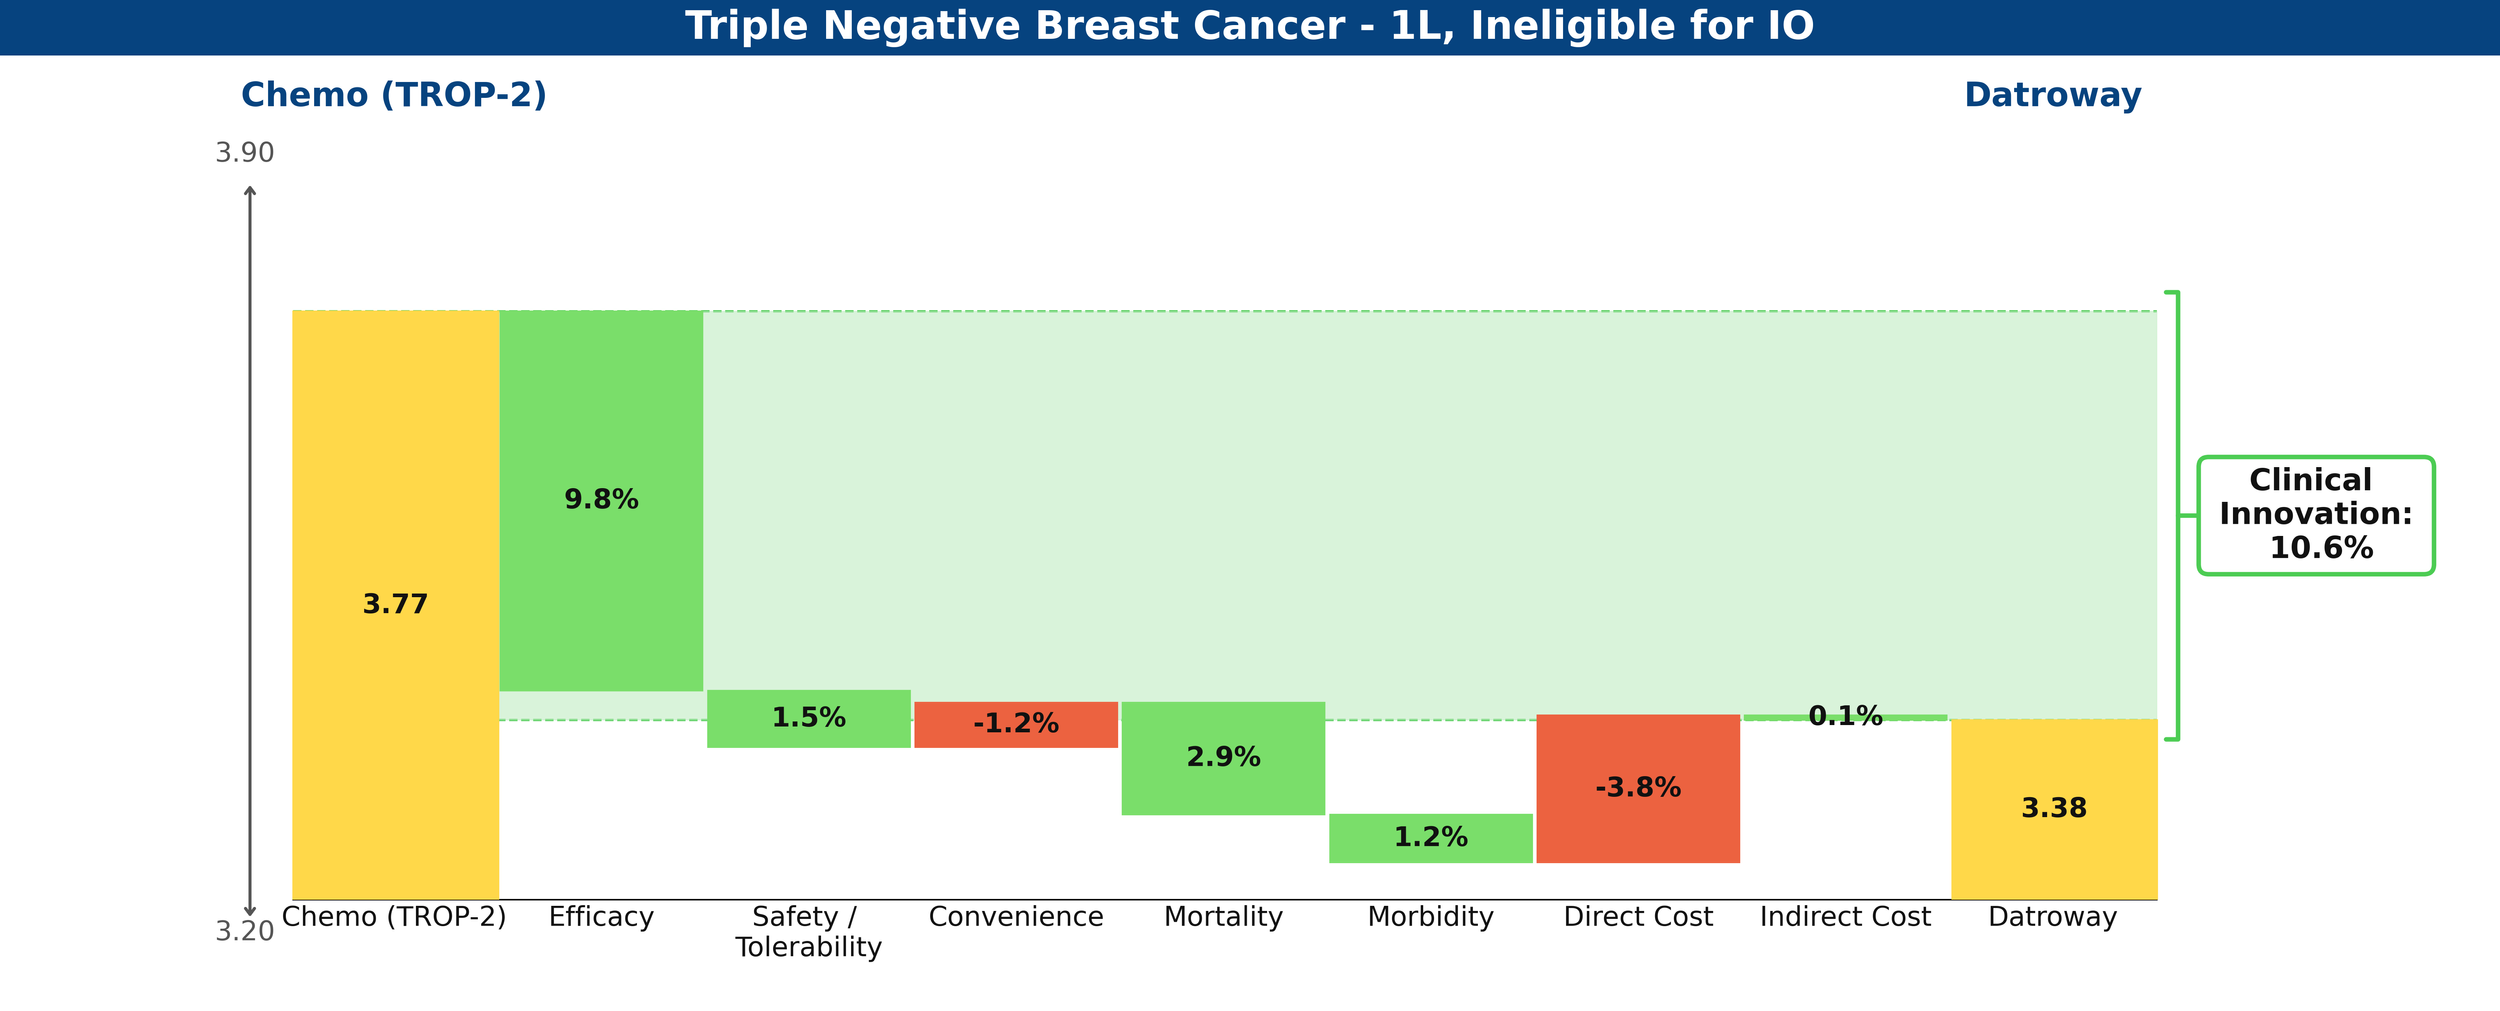
Figure 1: Drivers of Clinical Innovation – Datroway in 1L TNBC ineligible for IO
In comparison, Trodelvy’s weaker PFS benefit and immature (and insignificant at this time) OS data produce a less favorable gain, with a net Clinical Innovation score of -0.7%, essentially looking equivalent to chemotherapy.
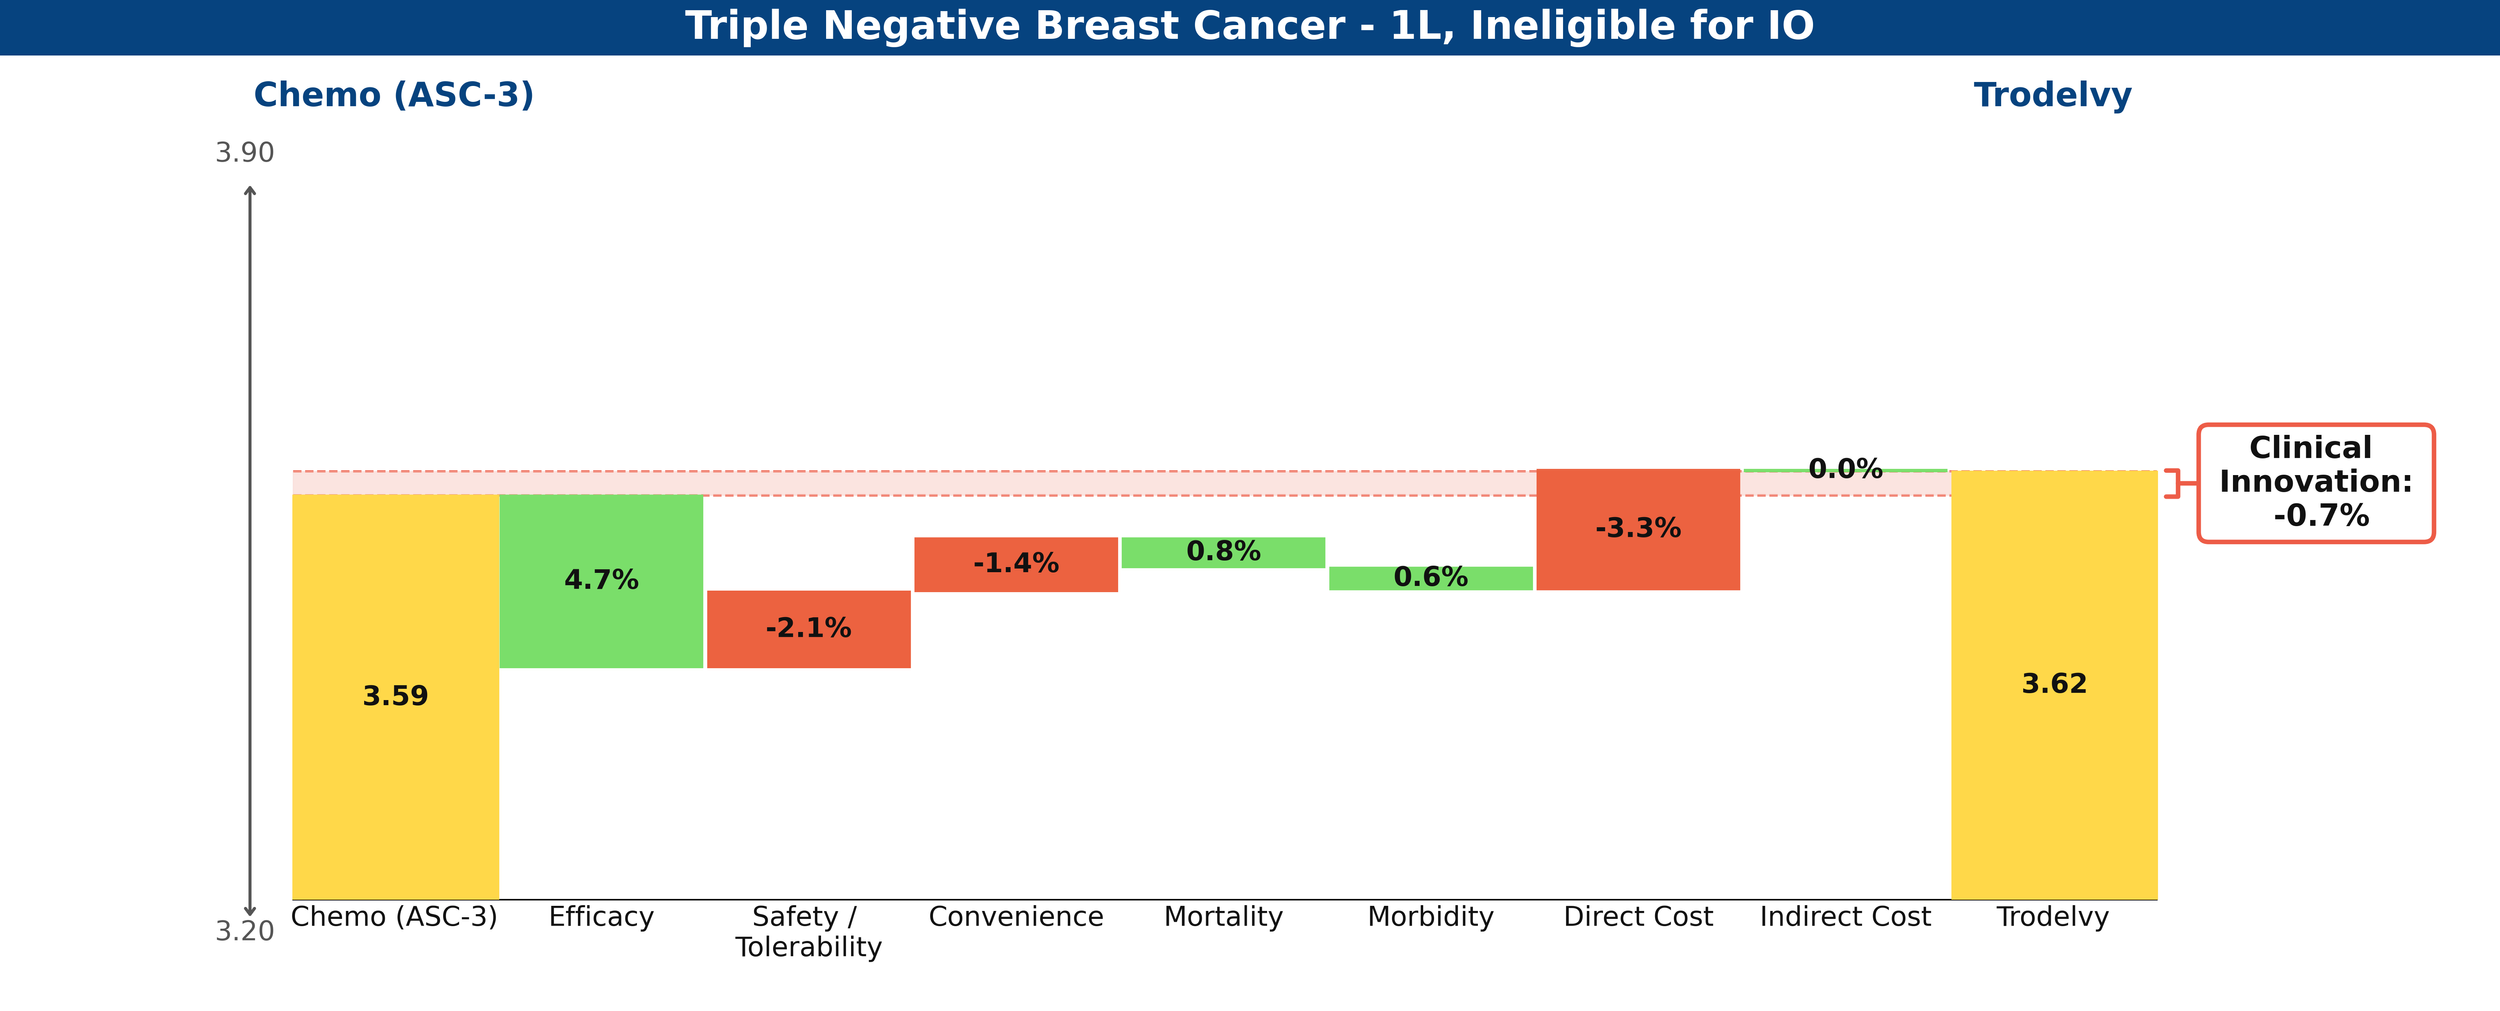
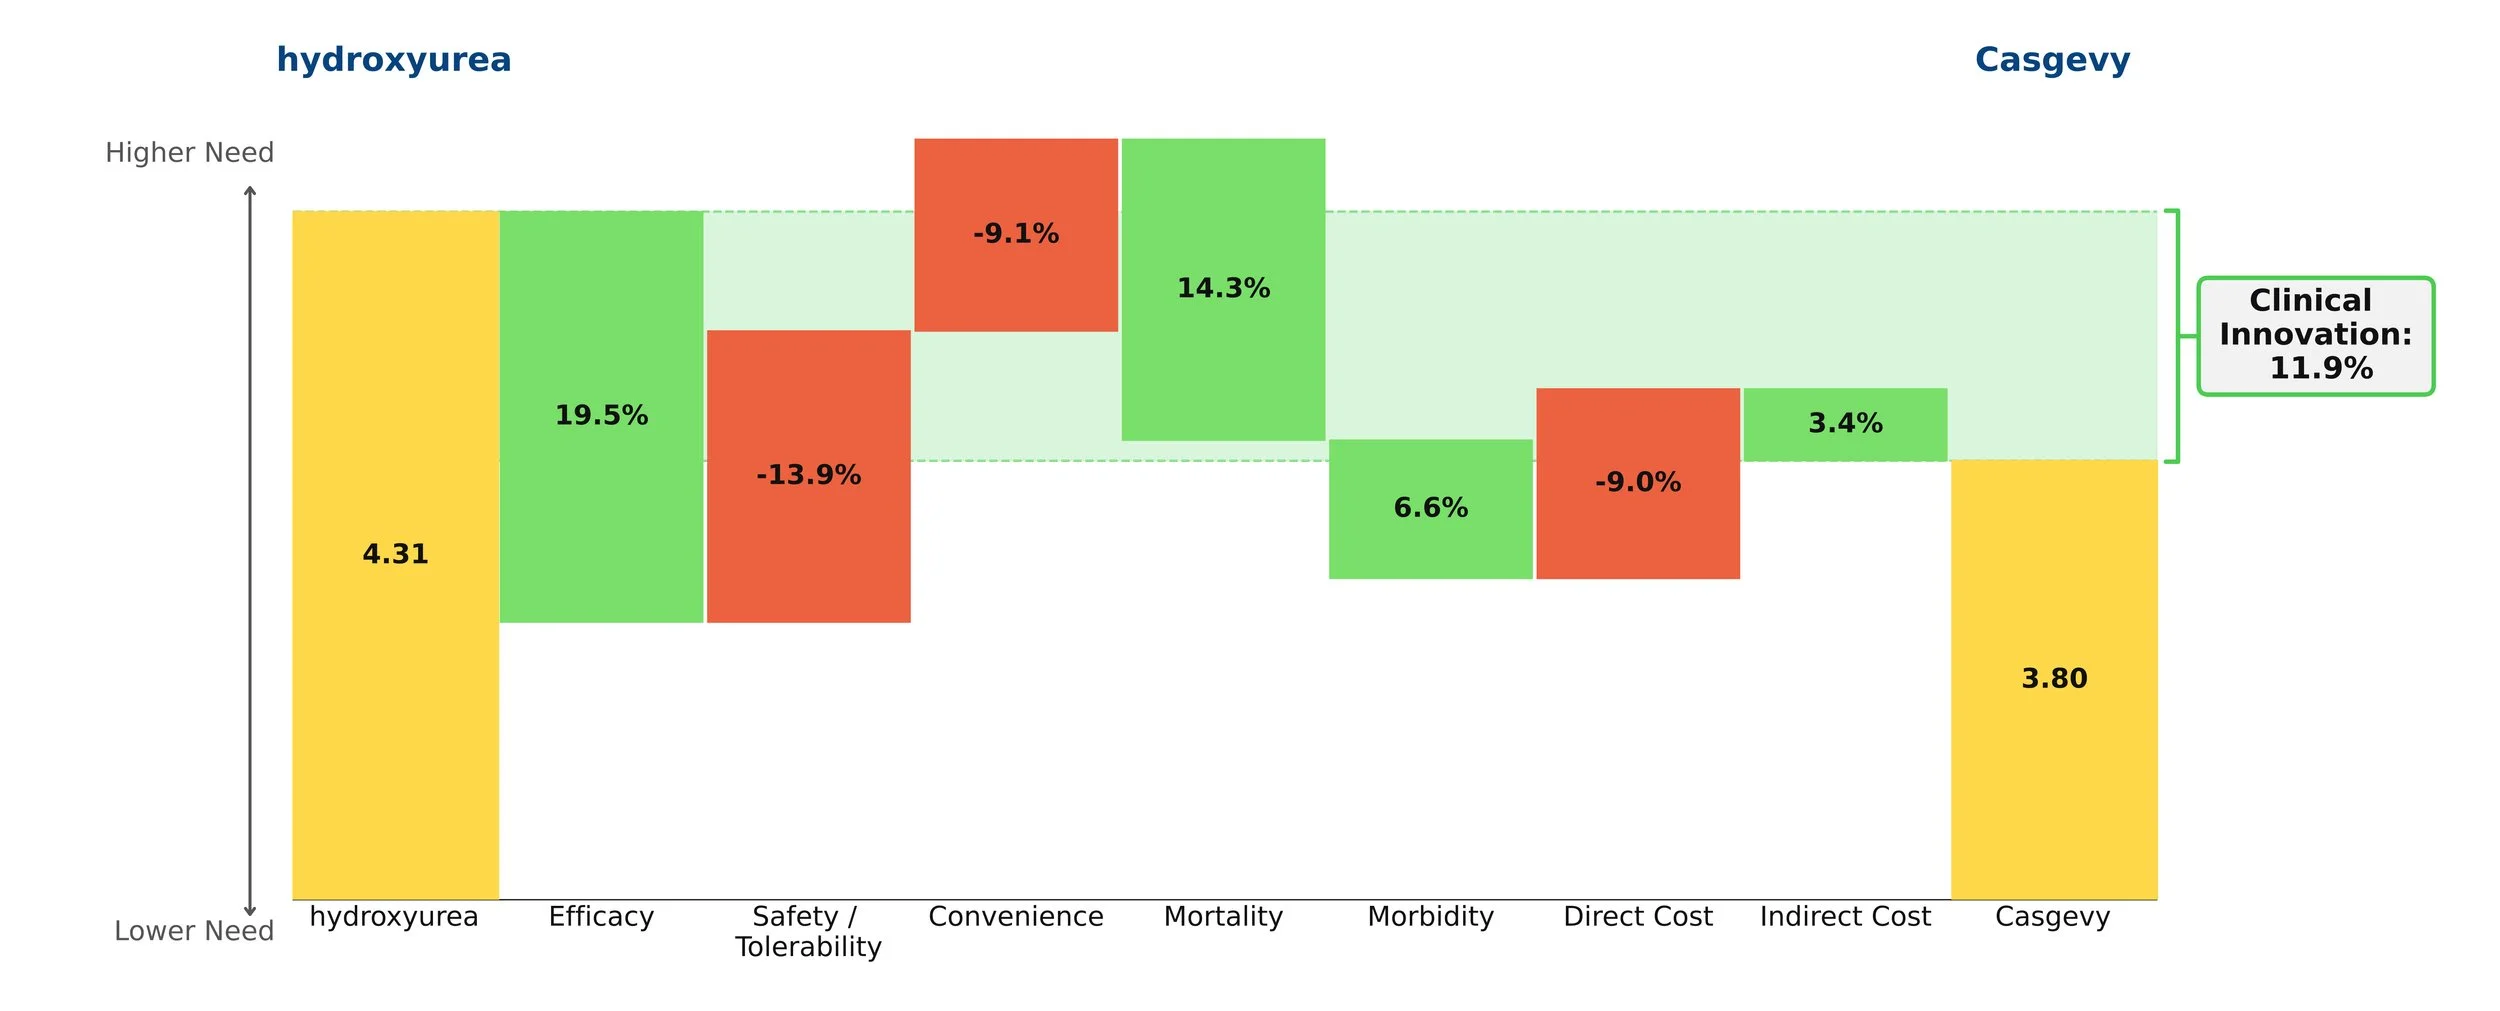
Figure 2: Drivers of Clinical Innovation – Trodelvy in 1L TNBC ineligible for IO
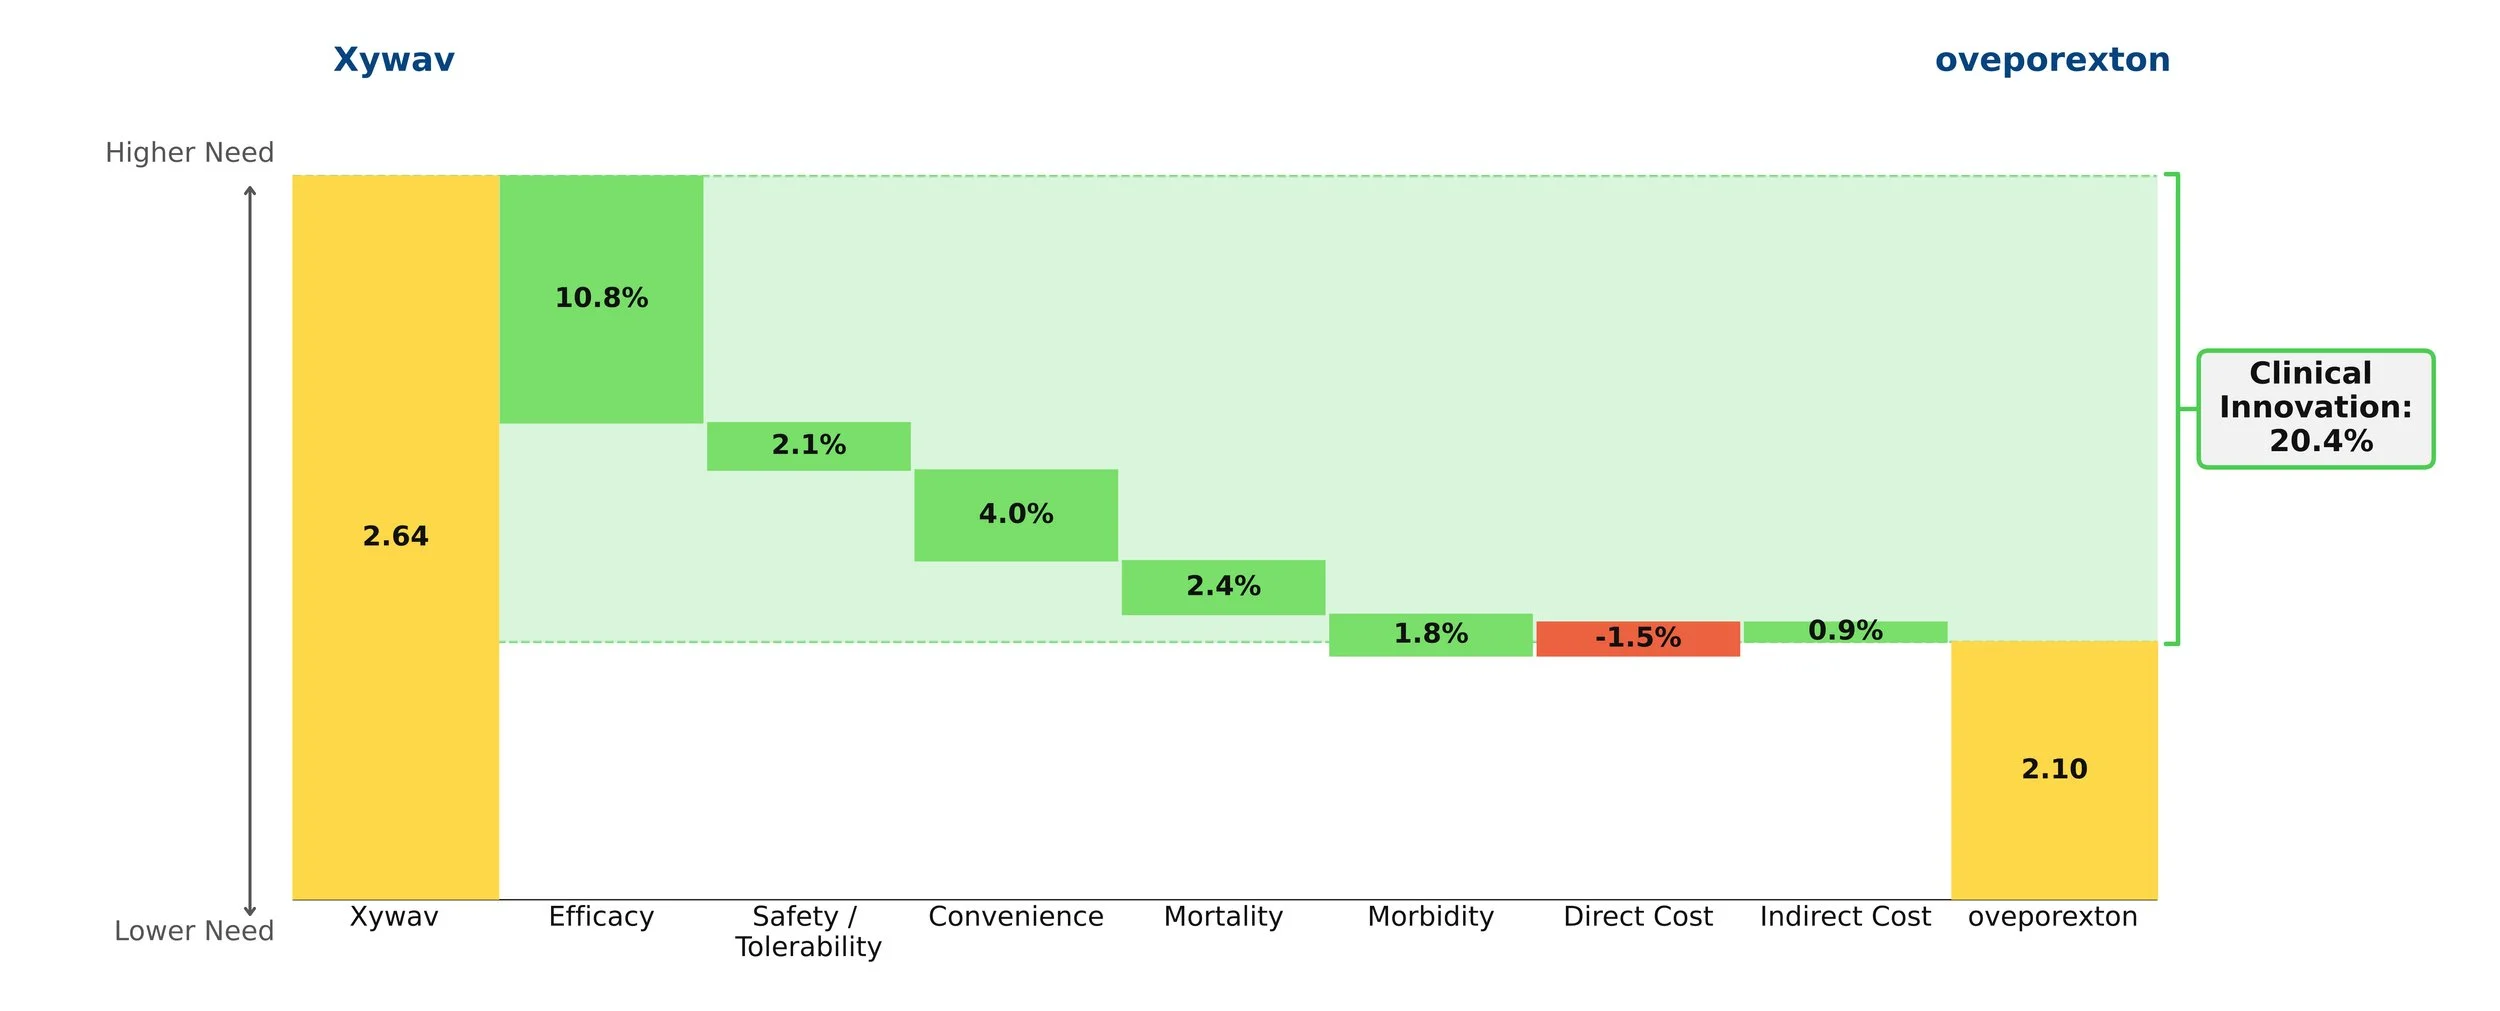
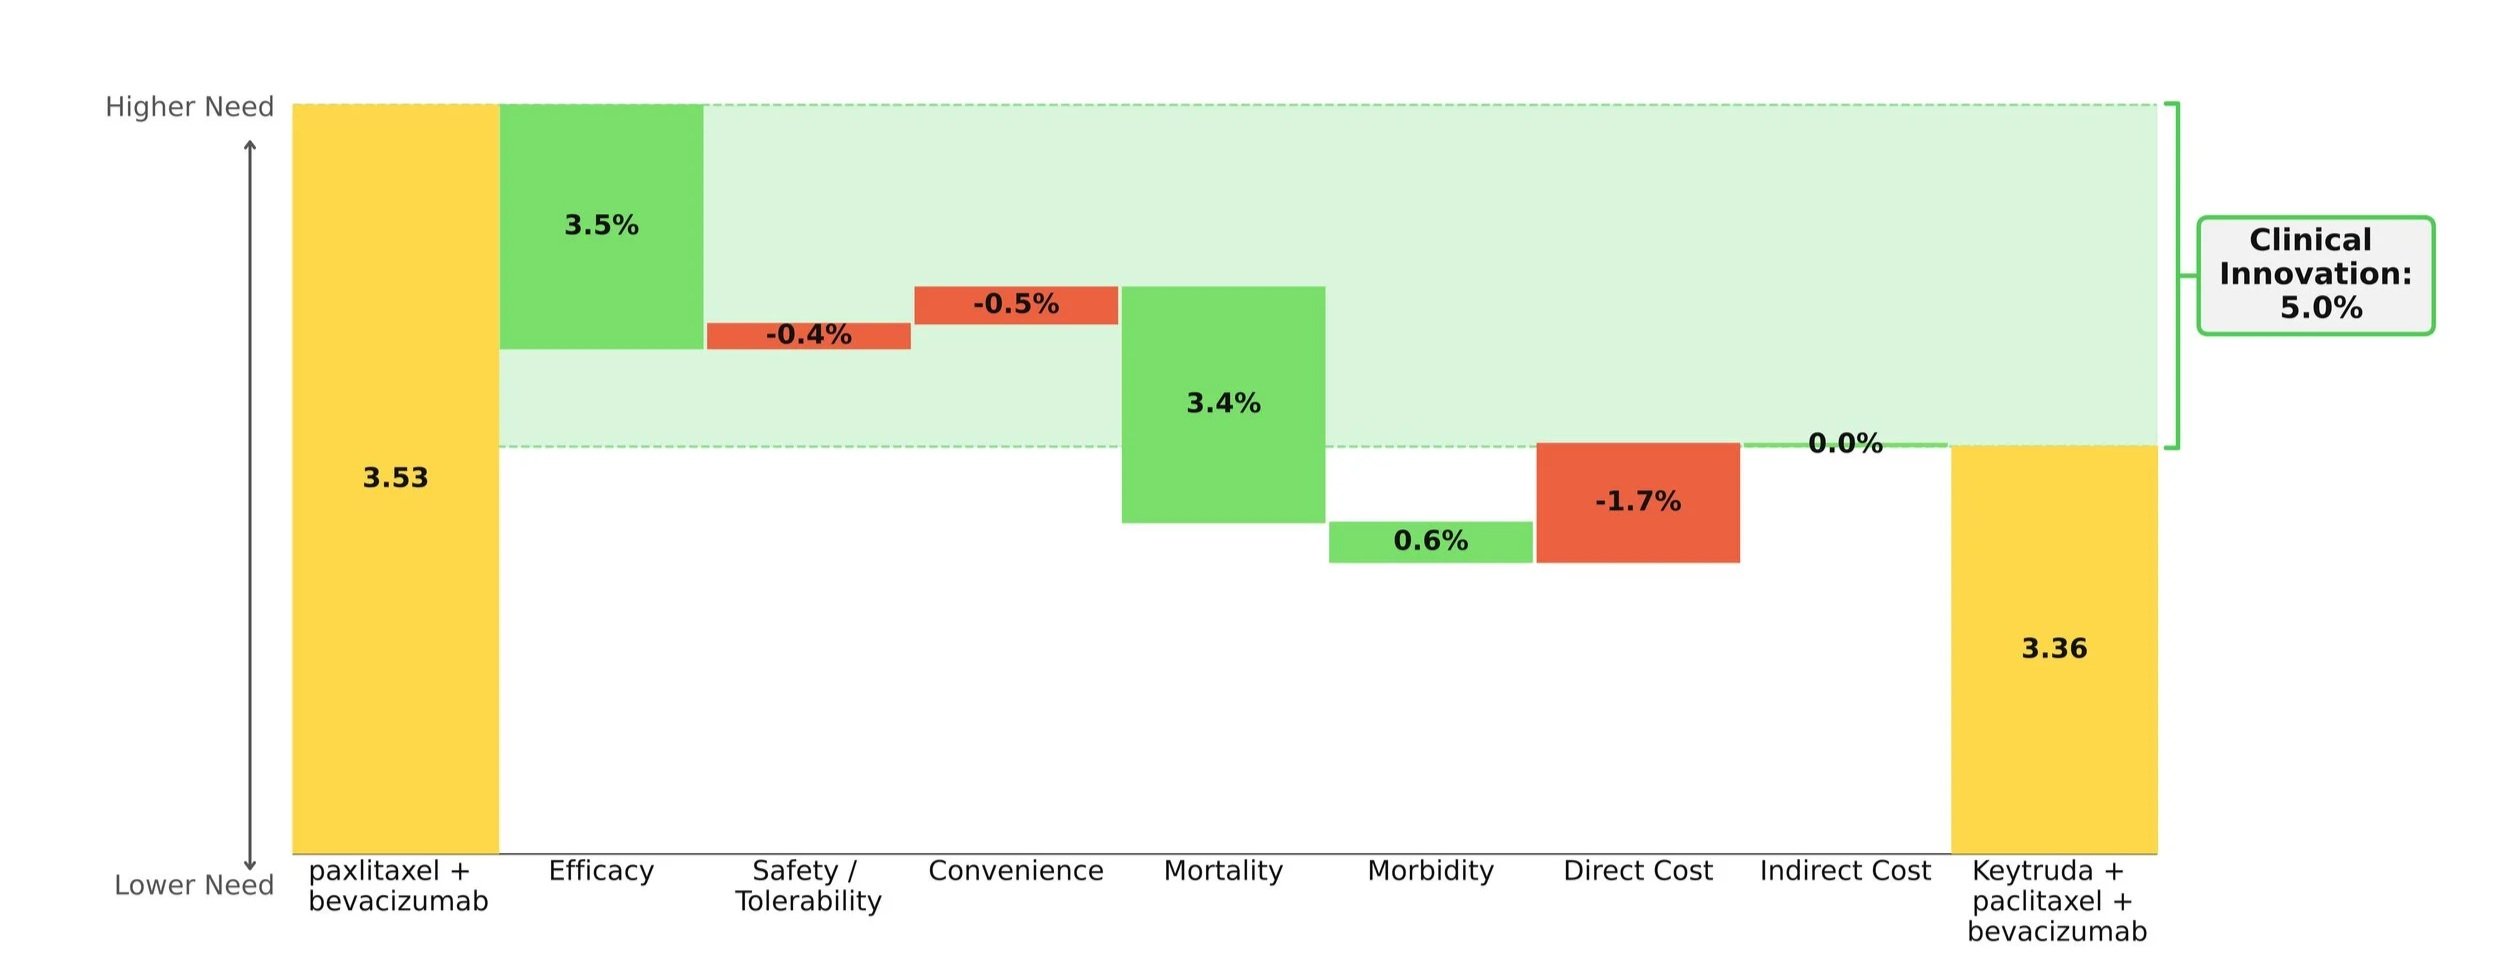
Compared against each other, Datroway’s Clinical Innovation score is 6.7%, significantly differentiated against Trodelvy.
Figure 3: Drivers of Clinical Innovation – Datroway vs. Trodelvy in 1L TNBC ineligible for IO
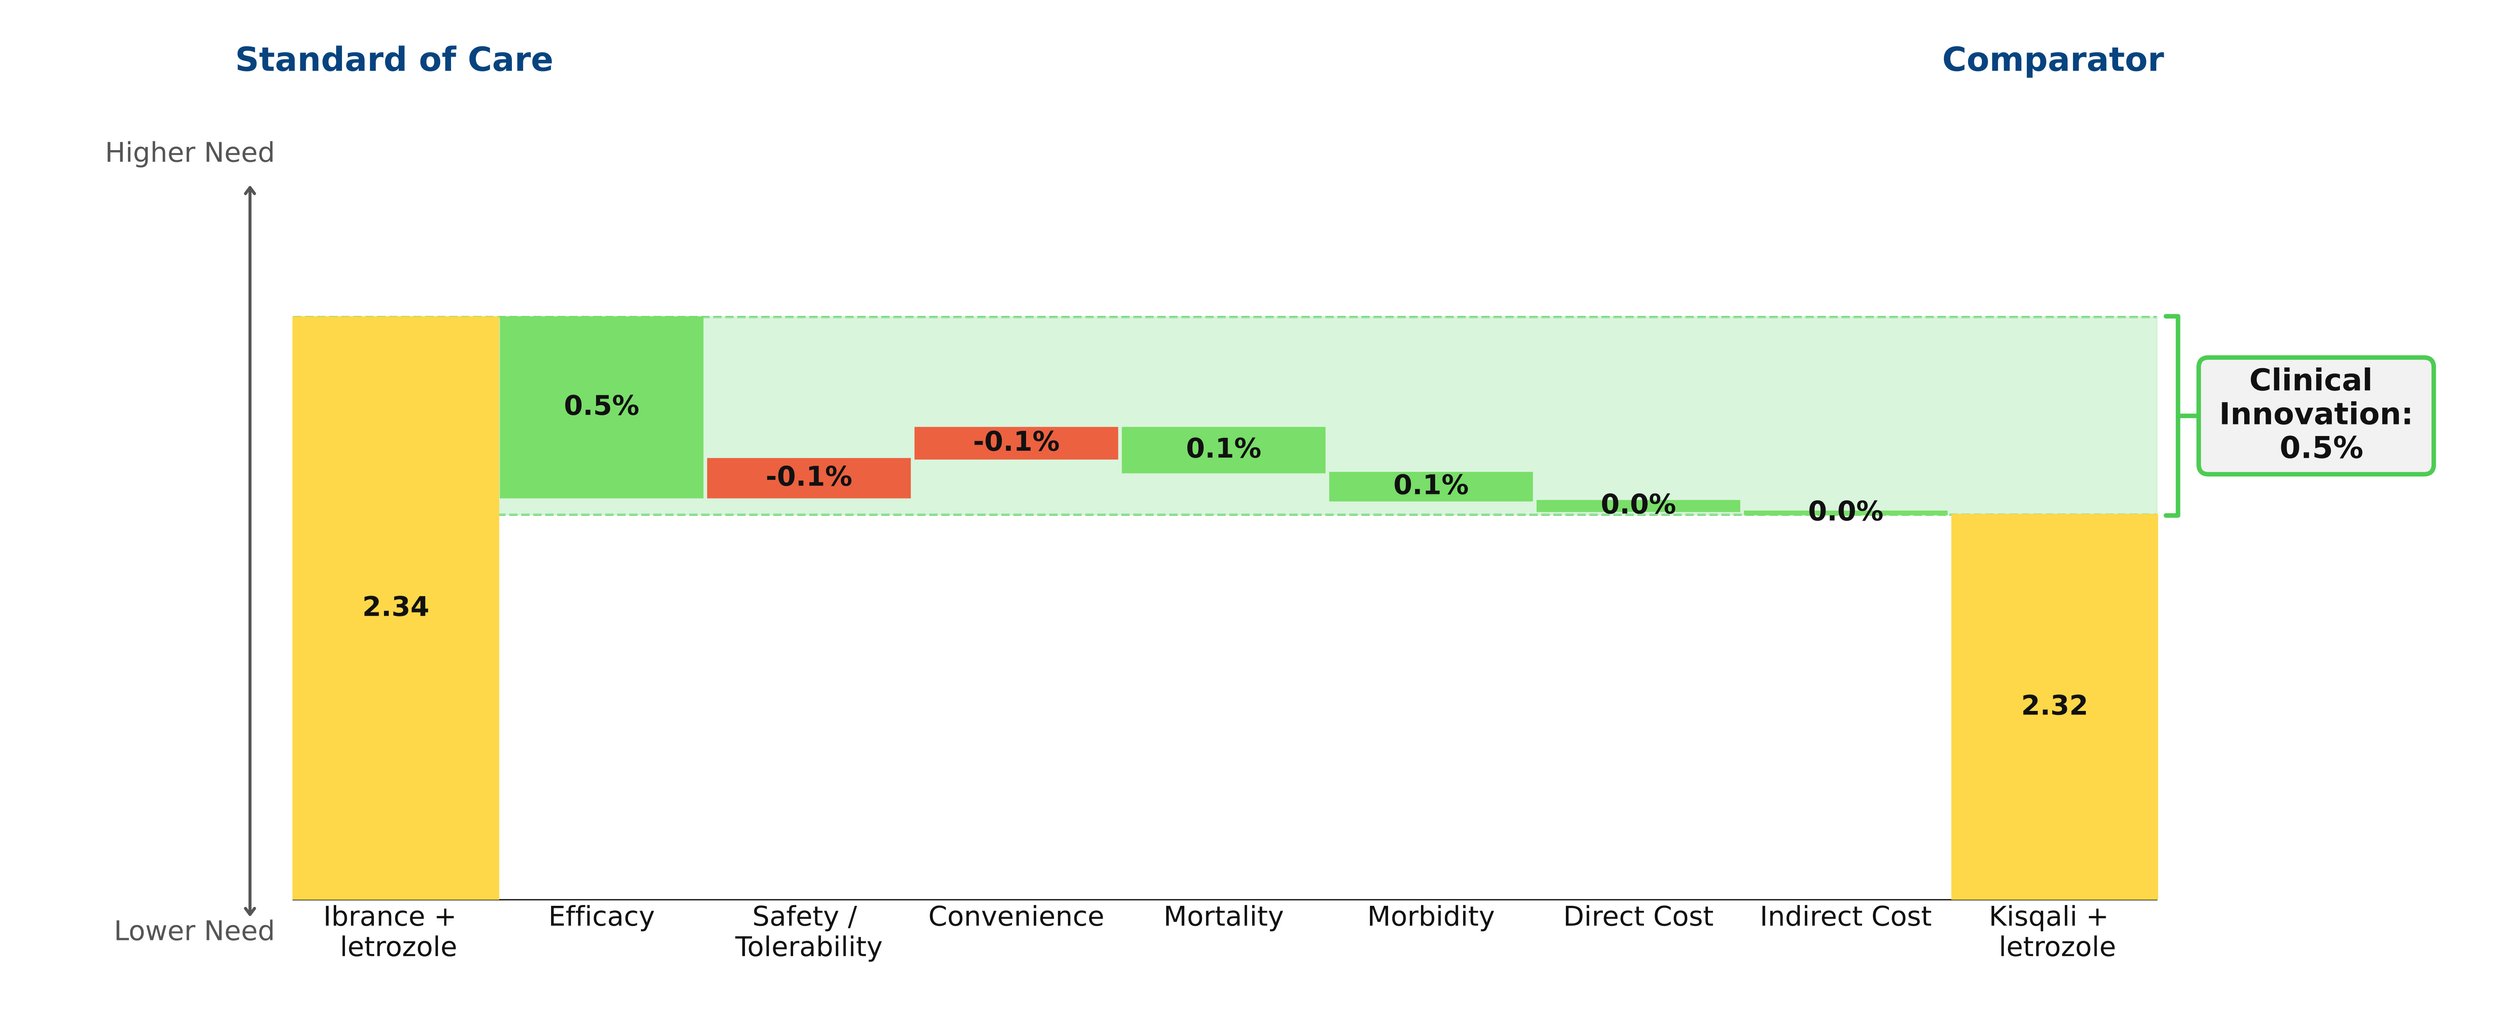
Trodelvy’s story is rosier in the PD-L1-positive cohort, delivering a 7.2% reduction in unmet medical need when combined with Keytruda, compared to chemotherapy plus Keytruda—a competitive Clinical Innovation score.
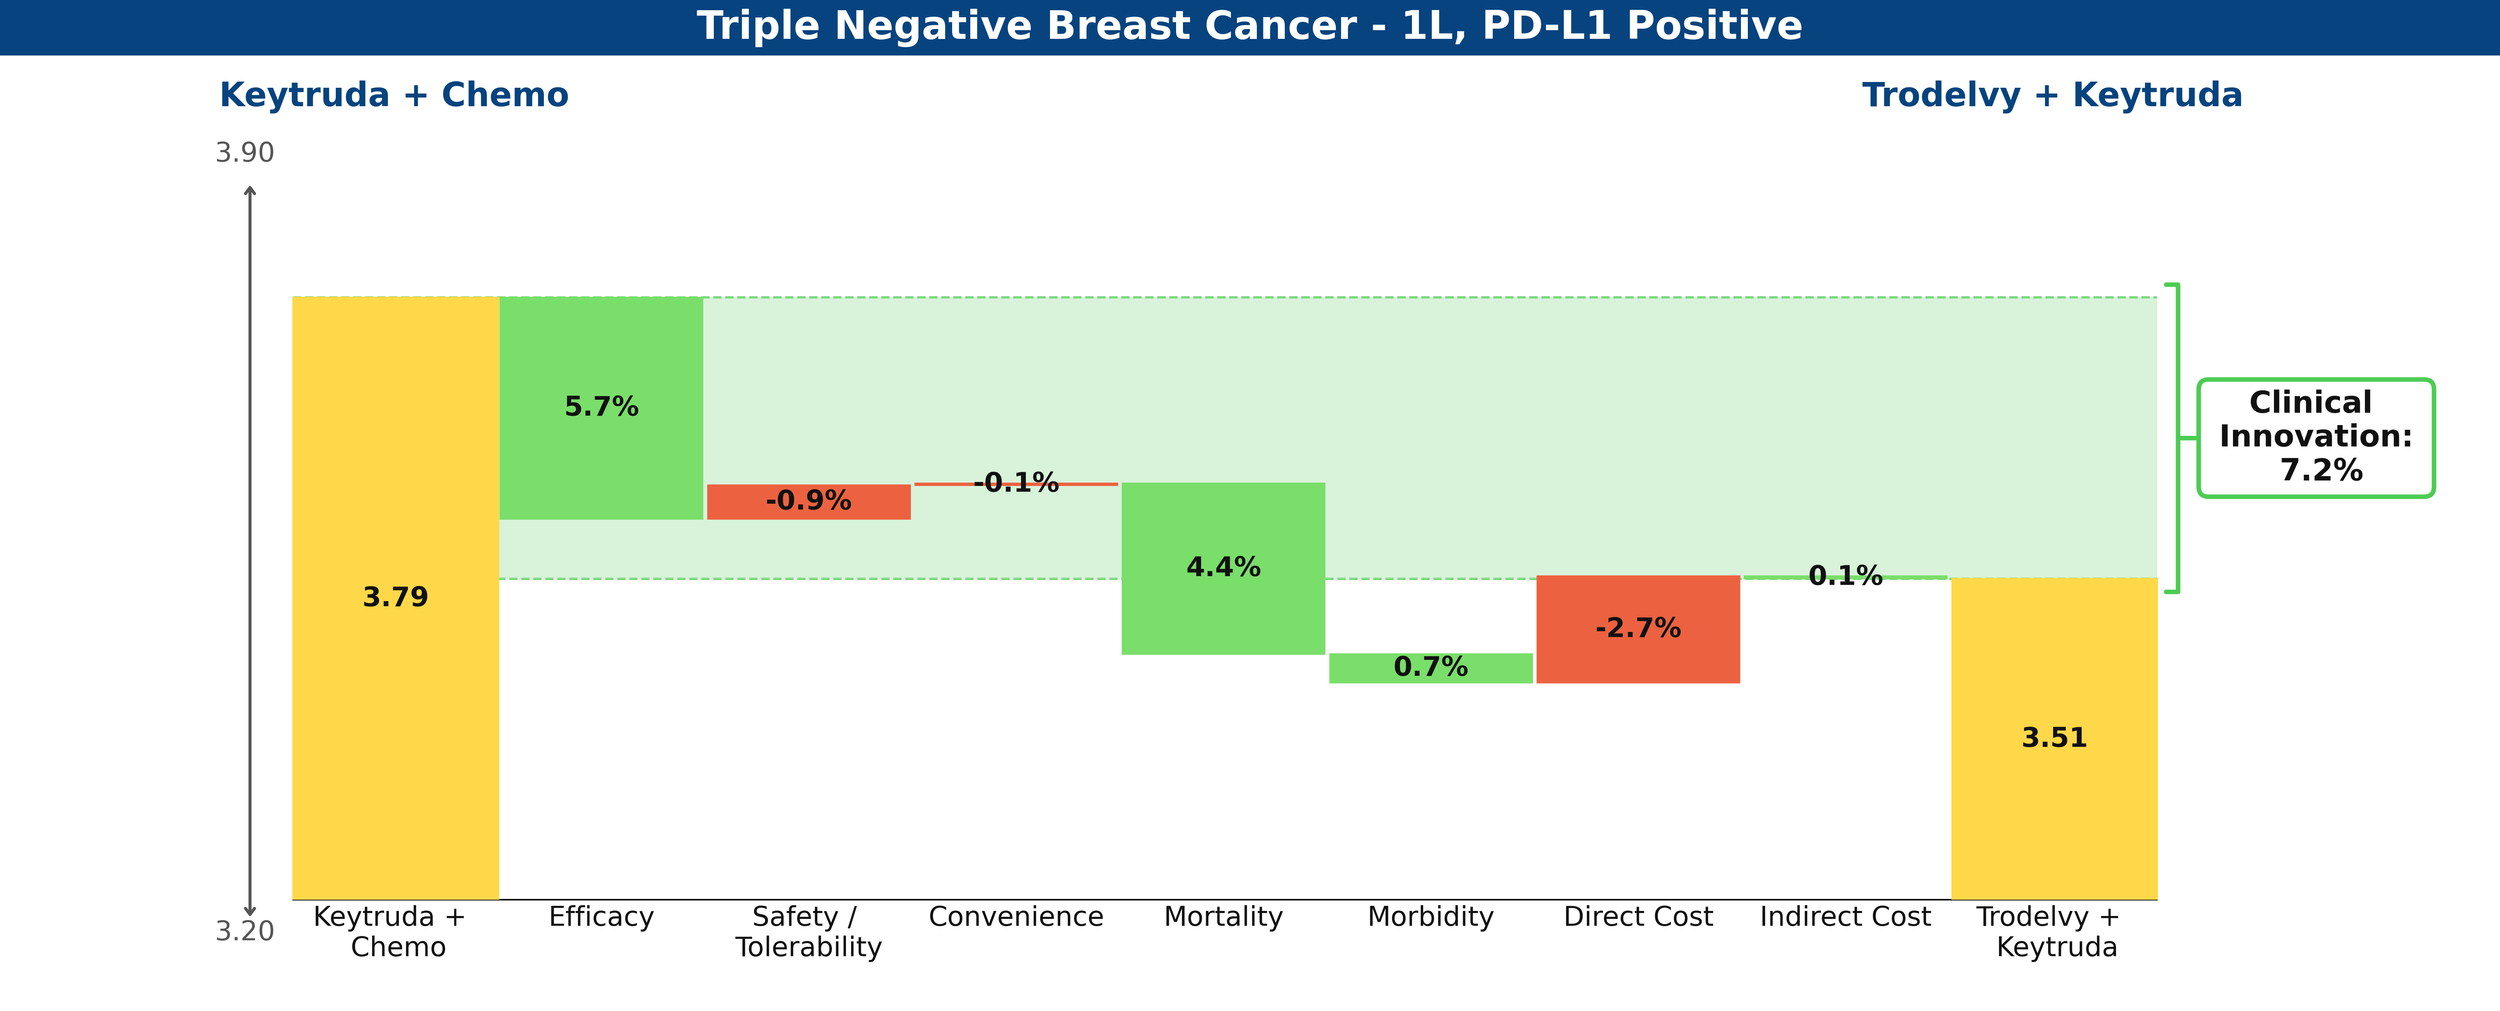
Figure 4: Drivers of Clinical Innovation – Trodelvy in 1L TNBC, PD-L1-positive
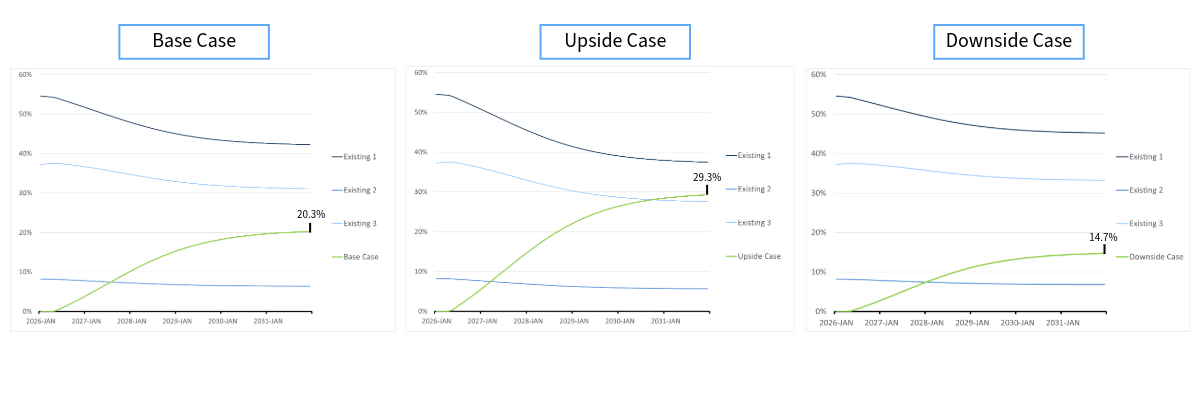
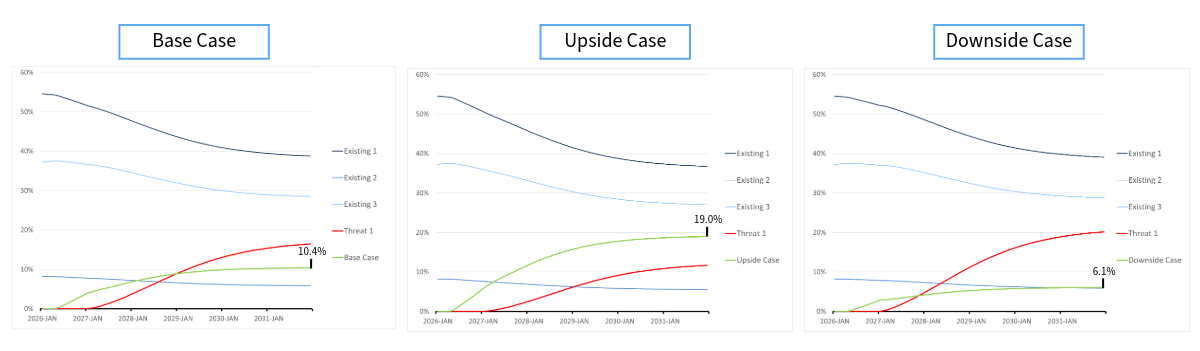
Share Prediction
With the innovation scores above and low levels of existing competition, Equinox Group predicts that Datroway could achieve a 56[JL1] [KC2] [JL3] % peak share in the IO-ineligible population and that Trodelvy could achieve a 60[JL4] [KC5] % peak share in the PD-L1-positive cohort.
Datroway is currently in clinical development for the treatment of PD-L1-positive 1L TNBC, in combination with AstraZeneca’s in-house PD-L1 inhibitor, Imfinzi (atezolizumab), which to date has no approvals in breast cancer (this trial, TROPION-Breast05 is expected to read out by mid-2027). Both Datroway and Trodelvy are trialing in pre-metastatic TNBC, as well, with Datroway’s trial expecting to read out mid- 2027 and Trodelvy’s by the end of 2028.
What remains for this field is the promise of yet another TROP2 ADC, Merck’s sacituzumab tirumotecan (sac-TMT). In its phase 2 OptiTROP-Breast05 trial, Sac-TMT demonstrated improved response rates over its in-class competitors across the PD-L1 spectrum.
[1] Dent et al. 2026 (TROPION-Breast02)