
Finding the Right Price for a Drug across Multiple Indications; Learnings from Keytruda
Previously, Equinox has described a hypothetical exercise in which a development team attempts to find an optimal price for an agent that is in development in multiple indications.
Here we repeat this exercise with a real-world example, Keytruda.
Keytruda has been approved for a variety of indications.
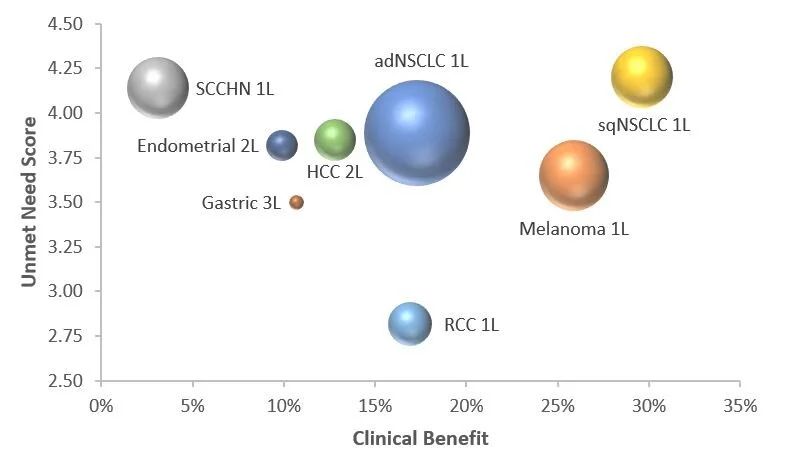
These indications differ in the size of the addressable patient population (bubble size), the level of unmet need (y axis) and, most importantly, the degree to which Keytruda delivers benefit to patients (x axis).
Finding the right price-per-vial across diverse indications is challenging. Equinox’s analytical tools allow product teams to quantify the value delivered in each population. When we plot the incremental clinical benefit delivered against incremental cost for successful agents, we see the following “cloud” relationship:

Each point represents a new agent in a specific patient population.
Equinox predicts that emerging agents that map within this cloud will receive favorable reimbursement, but agents that land below the cloud risk significant push-back from payers in those indications. Points above the cloud represent indications where the agent is under-priced.
Compared to these exemplars, Keytruda’s various indications map as follows:
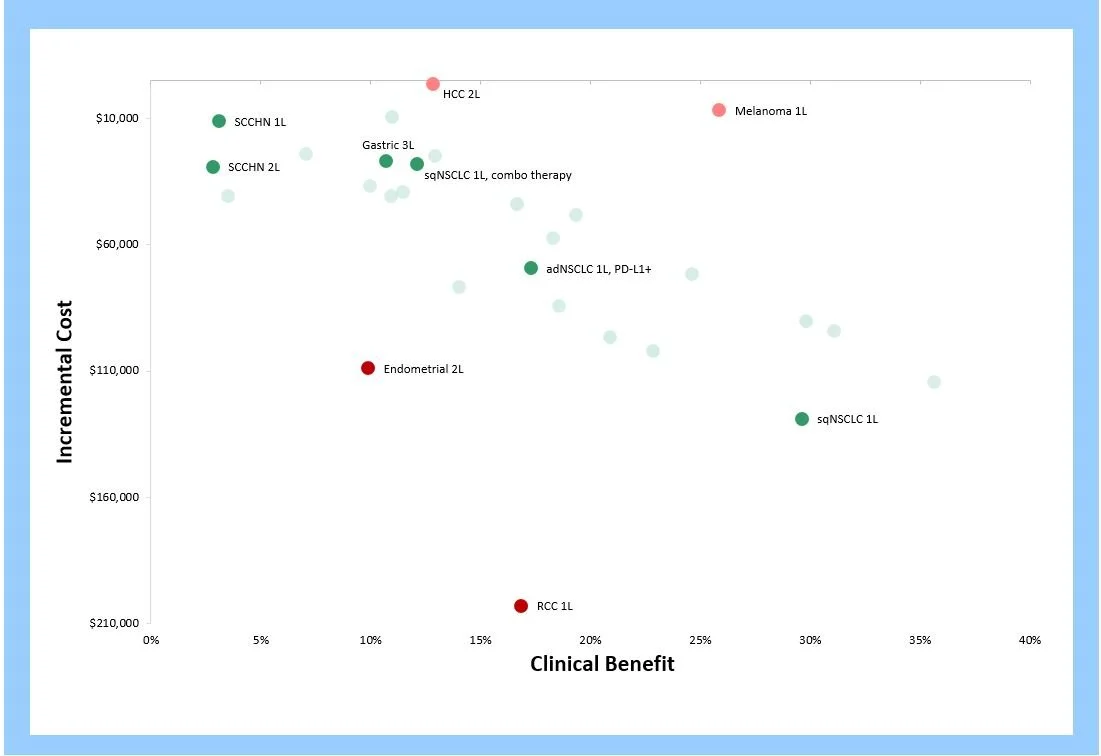
Keytruda’s price appears appropriate for Gastric, Head and Neck, and Lung Cancer. As a consequence, it offers poor value for money in RCC and Endometrial, and leaves money on the table in HCC and Melanoma. Overall, the price point appears optimized.
Equinox’s analytical tools allow product teams to assess the trade-offs inherent in arriving at a price for any agent in development for multiple indications.