
Cogent’s bezuclastinib reduces risk of disease progression or death by 50% in 2L metastatic GIST when combined with standard of care
Following a primary readout of the phase 3 PEAK trial at ASCO in late May, Cogent Biosciences seems poised to receive its first FDA approval with highly-innovative bezuclastinib in 2L GIST (following 1L failure on imatinib) with a PDUFA goal date of November 30, 2026.
Imatinib, which has been off-patent since 2020, remains the standard of care (SOC) in 1L GIST and has brought 5 year survival for advanced GIST patients to 56%. [1] However, once patients reach second line, they are left with treatment options that leave plenty of room for improvement. Unlike the currently approved tyrosine kinase inhibitors (TKIs), bezuclastinib is a highly selective inhibitor of mutant KIT, an oncogene acting as the driver in over 75% of gastrointestinal stromal tumor (GIST) cases. [2] This selectivity, when combined with a multi-kinase inhibitor such as sunitinib, offers improved coverage of post-imatinib resistance mutations.
In the phase 3 PEAK trial, combining bezuclastinib with the 2L SOC sunitinib resulted in a 50% reduction in the risk of disease progression or death, with the median progression-free survival increasing from 9.2 months on sunitinib alone to 16.5 months on the combination regimen. Adding bezuclastinib also delivered a 20 percentage point-improvement in overall response rate. [3]
Although overall survival data are not yet mature, the progression-free survival data are strongly suggestive of an improvement in OS. Using our historical oncology database which explores the relationship between mOS and mPFS across tumor types, Equinox Group estimates the base case mOS to be 45.0 months with the upside case being 51.4 months. These represent a 22% and 32% improvement over sunitinib monotherapy, respectively.
If we assume that Cogent will price bezuclastinib similarly to Sanofi’s KIT TKI Ayvakit (approved in 2020), we can see that despite the substantial cost increase when compared with generic sunitinib, bezuclastinib offers strong Clinical Innovation scores of 6.4% and 9.4% in the base and upside cases.
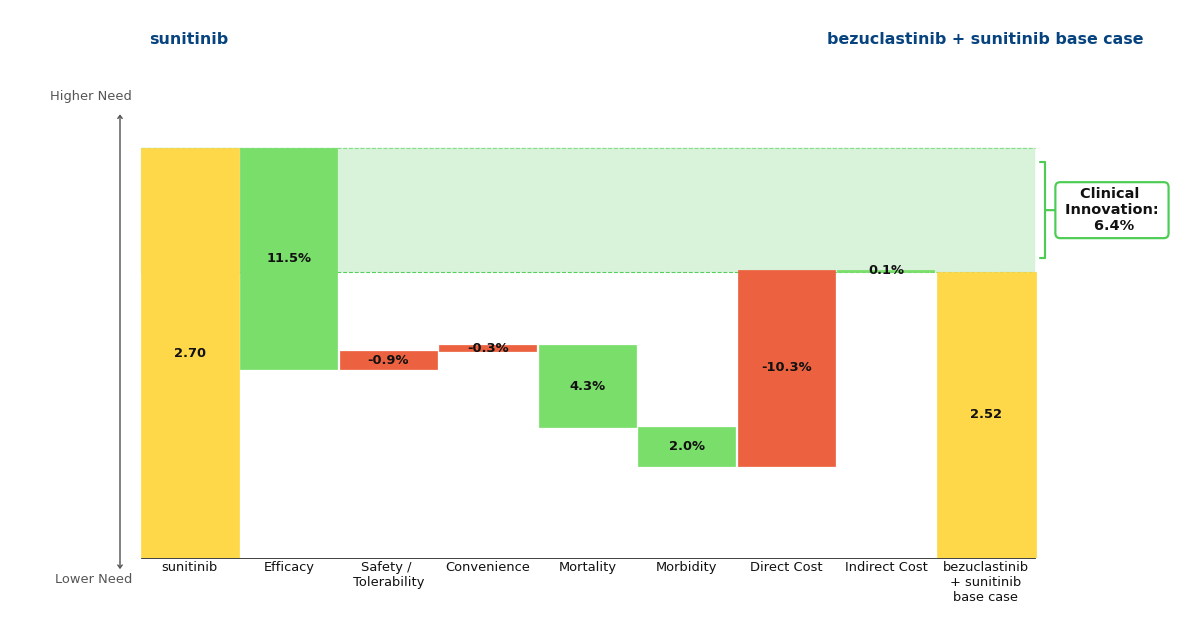
Figure 1: Drivers of Clinical Innovation - Base Case
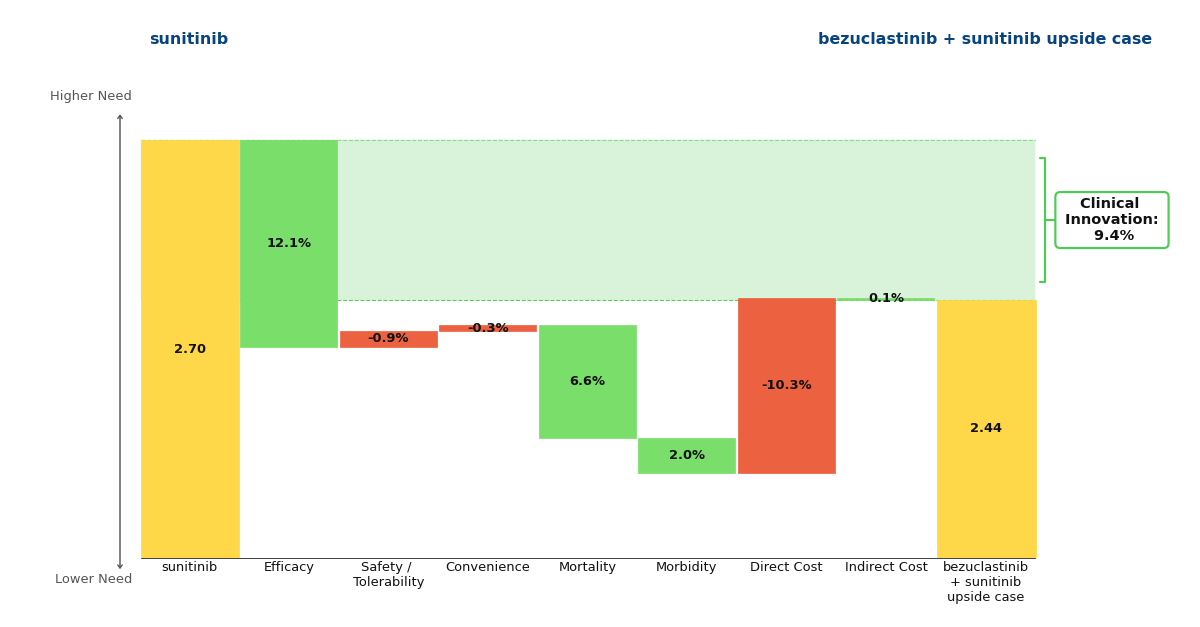
Figure 2: Drivers of Clinical Innovation - Upside Case
These percentages represent the reduction in unmet medical need that a drug offers when compared to the standard of care. Historically, a Clinical Innovation score >5% predicts that a drug will be commercially successful, with scores >10% being characteristic of a market dominator. Under this framework, it is clear that bezuclastinib is commercially promising and a noteworthy advancement in the GIST paradigm.
This readout comes at an advantageous time for Cogent. Its closest competitor, Qinlock (ripretinib, Deciphera Pharmaceuticals), which previously failed to differentiate itself against sunitinib in the second-line population, won't deliver its own phase 3 results until the primary readout of the INSIGHT trial in December 2027. [4] Importantly, this trial is exclusively looking at a subset of patients harboring co-occurring KIT exon 11 + 17 and/or 18 mutations, a strategy informed by a retrospective analysis of the previous phase 3 INTRIGUE trial’s failure. [5] Qinlock's fourth-line approval and established manufacturing, along with physician familiarity suggest it could scale quickly in this second line subset if the INSIGHT trial succeeds. Cogent's task is therefore to capitalize on its one to two year lead and entrench bezuclastinib + sunitinib as the broad second-line standard of care before Qinlock enters the space.
[1] BRF14 data demonstrate long-term efficacy of imatinib in advanced GIST. OncLive. August 22, 2025. Accessed July 6, 2026. https://www.onclive.com/view/brf14-data-demonstrate-long-term-efficacy-of-imatinib-in-advanced-gist.
[2] Helbing A, Menon G. Gastrointestinal Stromal Tumors. [Updated 2025 Sep 14]. In: StatPearls [Internet]. Treasure Island (FL): StatPearls Publishing; 2026 Jan-. Available from: https://www.ncbi.nlm.nih.gov/books/NBK554541/
[3] Andrew J. Wagner et al. Primary results of the phase 3 peak study of bezuclastinib + sunitinib vs sunitinib monotherapy in advanced gastrointestinal stromal tumors (GIST). J Clin Oncol 44, 11500-11500(2026).DOI:10.1200/JCO.2026.44.16_suppl.11500
[4] National Library of Medicine (US). ClinicalTrials.gov. Published February 17, 2023. Updated December 2025. Accessed July 6, 2026. https://clinicaltrials.gov/study/NCT05734105
[5] Heinrich MC et al. Ripretinib versus sunitinib in gastrointestinal stromal tumor: ctDNA biomarker analysis of the phase 3 INTRIGUE trial. Nat Med. 2024 Feb;30(2):498-506. doi: 10.1038/s41591-023-02734-5. Epub 2024 Jan 5. PMID: 38182785; PMCID: PMC10878977.
TROP2 ADCs: A Major Innovation for 1L TNBC
Gilead’s Trodelvy has made a name for itself in breast cancer, but recently Daiichi Sankyo AstraZeneca’s competing TROP2 ADC, Datroway, has beaten Trodelvy to market in 1L TNBC, a patient segment with traditionally no treatment options aside from chemotherapy alone. Approved one month apart from each other, Datroway has the stronger data, but Trodelvy has a broader label and physician experience on its side.
Approval Histories
In April 2020, Immunomedics’ novel TROP2 ADC, Trodelvy (sacituzumab govitecan-hziy), was granted accelerated approval for the treatment of relapsed or refractory triple-negative breast cancer (R/R TNBC), making it the first ADC approved by the FDA for this indication. Gilead went on to acquire Immunomedics and Trodelvy six months after its initial approval. Trodelvy was granted full approval in R/R TNBC in April 2021 and accelerated approval in pre-treated HR+/HER2- metastatic breast cancer in February 2023. Along the way, Gilead picked up and subsequently voluntarily withdrew an accelerated approval for the ADC in metastatic urothelial cancer.
No new TROP2 ADC had been approved since Trodelvy until January 2025, when Daiichi Sankyo and AstraZeneca’s Datroway (datopotamab deruxtecan-dlnk) was approved in pre-treated HR+/HER2- metastatic breast cancer, almost two years after Trodelvy’s approval in this indication. Datroway’s next approval came in June 2025 for pre-treated EGFR-mutated non-small cell lung cancer (NSCLC), an accelerated approval based on response rates from a pooled subgroup analysis of a broader population, beating Trodelvy to launch in lung cancer.
Clinical Data Summary
Now, within just one month of each other, the two TROP2 ADCs have each gained approval in previously-untreated TNBC, a patient population which to date has had chemotherapy as their only option in immunotherapy (IO)-ineligible patients. Datroway was first to be approved in 1L TNBC ineligible for IO, boasting an impressive 43% reduction in disease progression or death (PFS HR 0.57, p<0.0001) and 21% reduction in mortality, statistically significant at the 5% threshold (OS HR 0.79, p 0.0290) [1]. Trodelvy, just one month later, received approval regardless of a patient’s PD-L1 status, a broader population than that of Datroway. Trodelvy’s overall survival data are immature across both of its 1L TNBC populations, but its PFS benefits are still significant. In the PD-L1-negative/IO-ineligible segment, Trodelvy reduced the risk of disease progression or death by 38% (PFS HR 0.62, p<0.001)[2] compared to Datroway’s 43% reduction. For patients with a PD-L1 combined positive score (CPS) ≥ 10, Trodelvy + Merck’s Keytruda (pembrolizumab) boast a PFS HR = 0.65 (p<0.001) when compared to Keytruda + chemotherapy [3].
Equinox Group’s Analysis
Compared to their respective control arms in the IO-ineligible population, Datroway looks highly innovative using Equinox Group’s Disease Target Assessment (DTA) framework, reducing medical need by 10.6%; historically, improvements ≥10% become leaders in their market segments.
Clinical Innovation is displayed graphically in the below waterfall chart, where the unmet need score of the comparator regimen (chemotherapy) is represented on the left and the entrant (Datroway) on the right. Unmet need is scored on a 0-5 scale, with lower scores representing less unmet medical need. The individual green and red bars total to a regimen’s Clinical Innovation score.
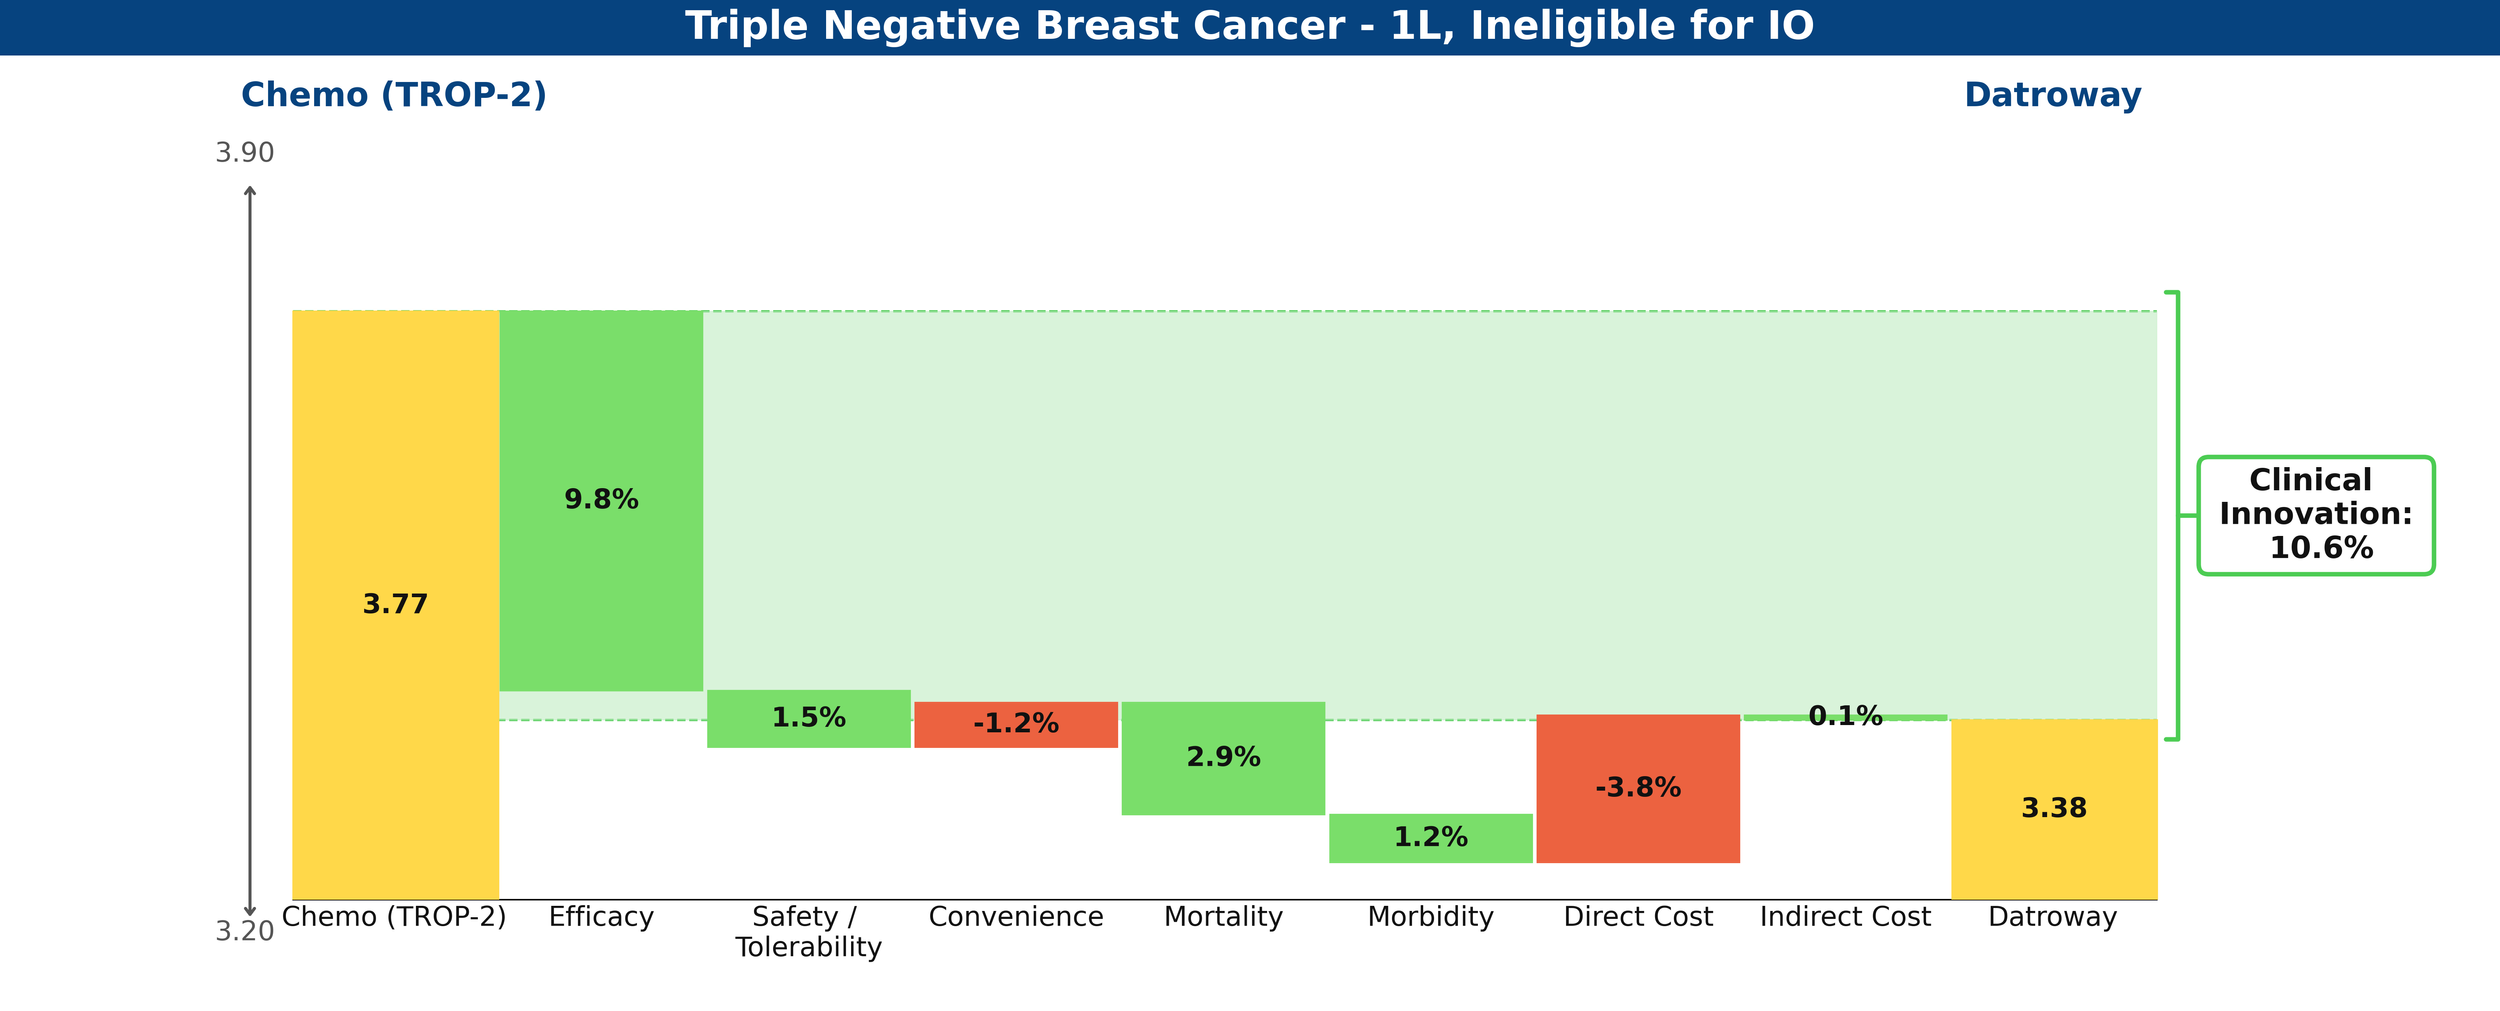
Figure 1: Drivers of Clinical Innovation – Datroway in 1L TNBC ineligible for IO
In comparison, Trodelvy’s weaker PFS benefit and immature (and insignificant at this time) OS data produce a less favorable gain, with a net Clinical Innovation score of -0.7%, essentially looking equivalent to chemotherapy.
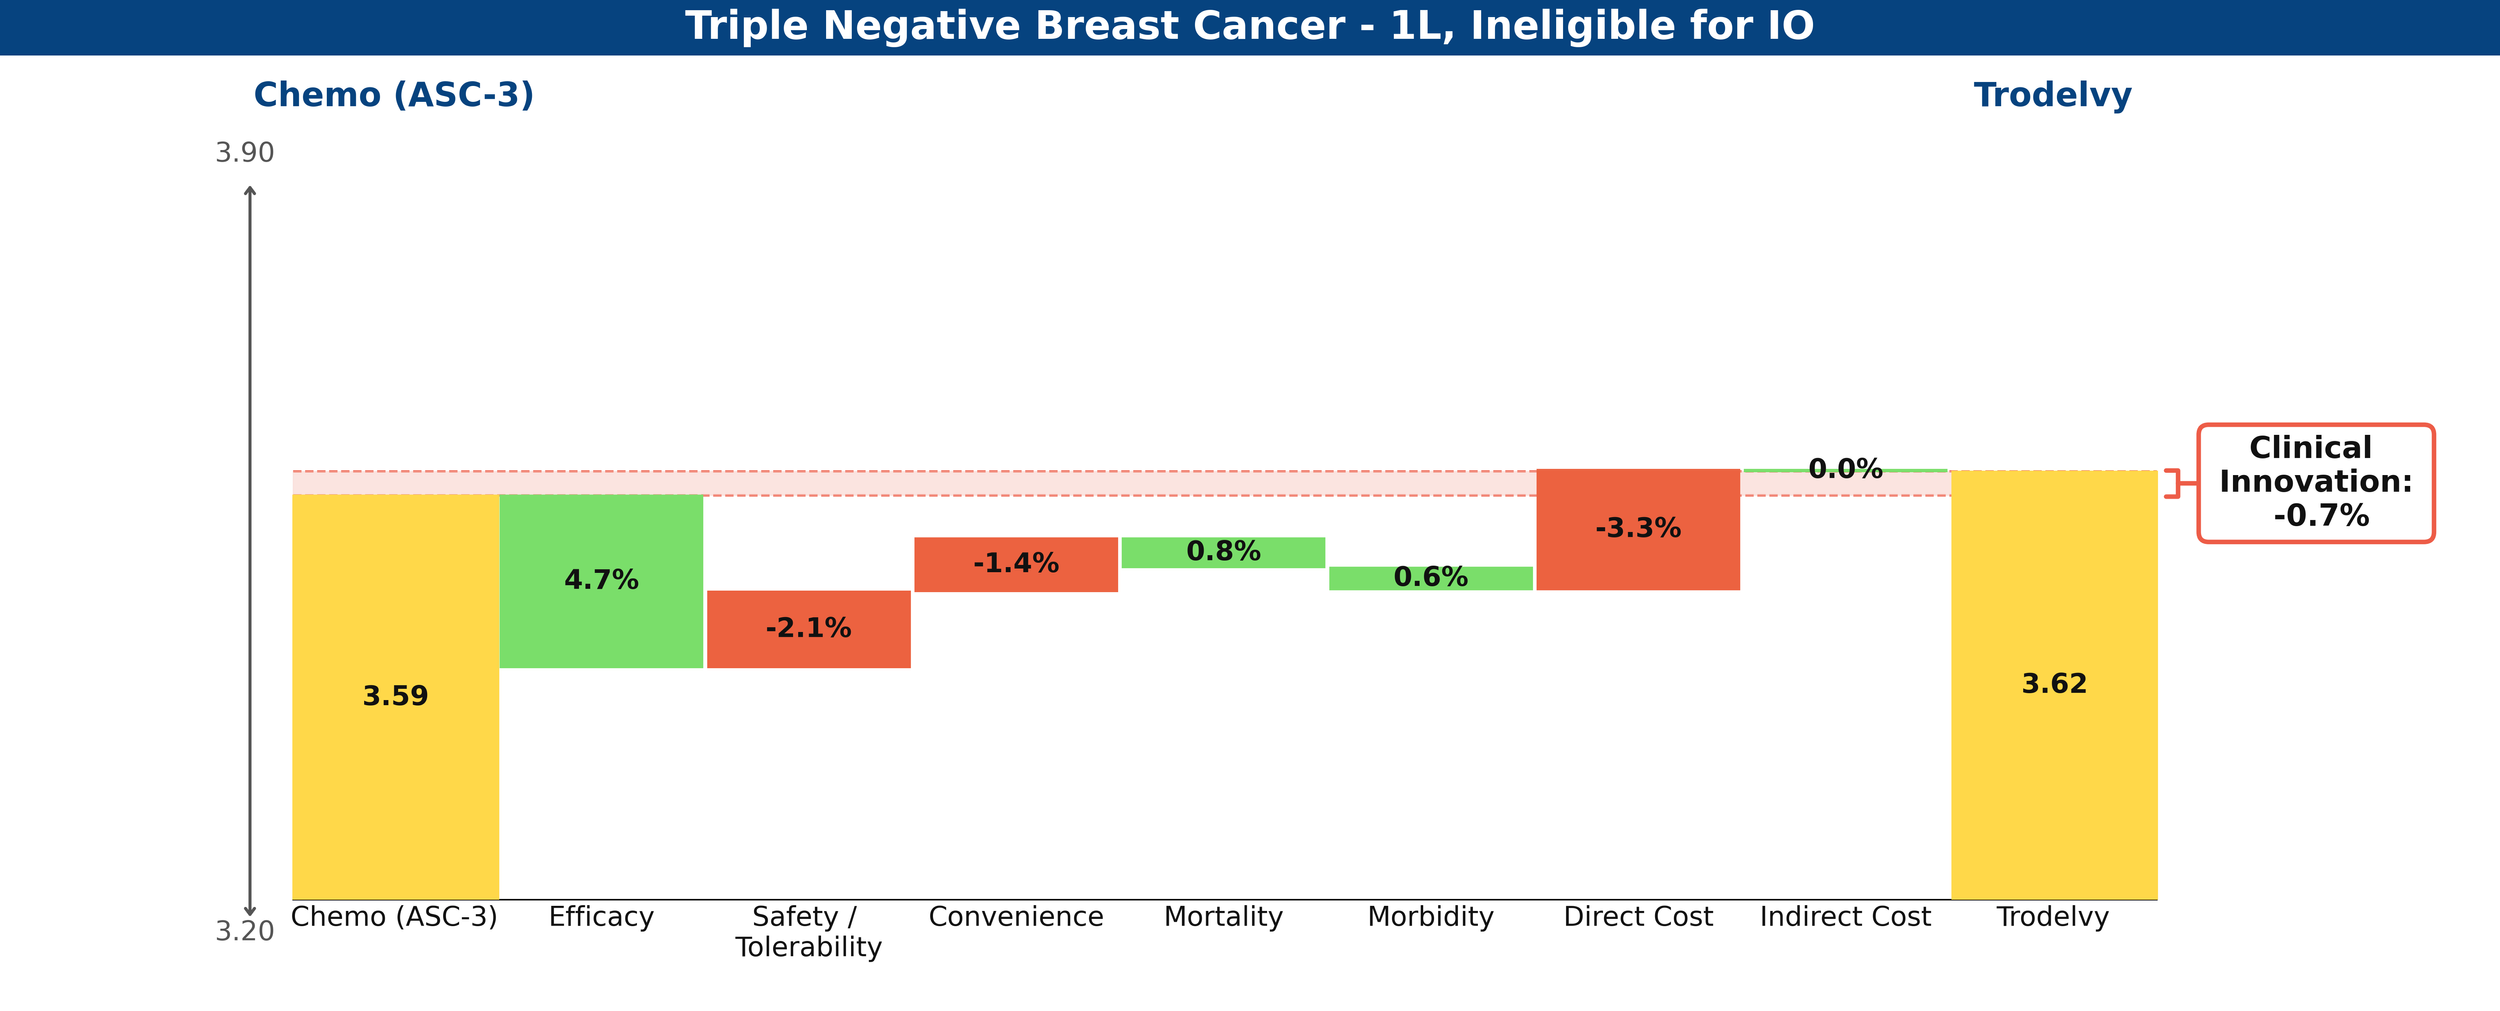
Figure 2: Drivers of Clinical Innovation – Trodelvy in 1L TNBC ineligible for IO
Compared against each other, Datroway’s Clinical Innovation score is 6.7%, significantly differentiated against Trodelvy.
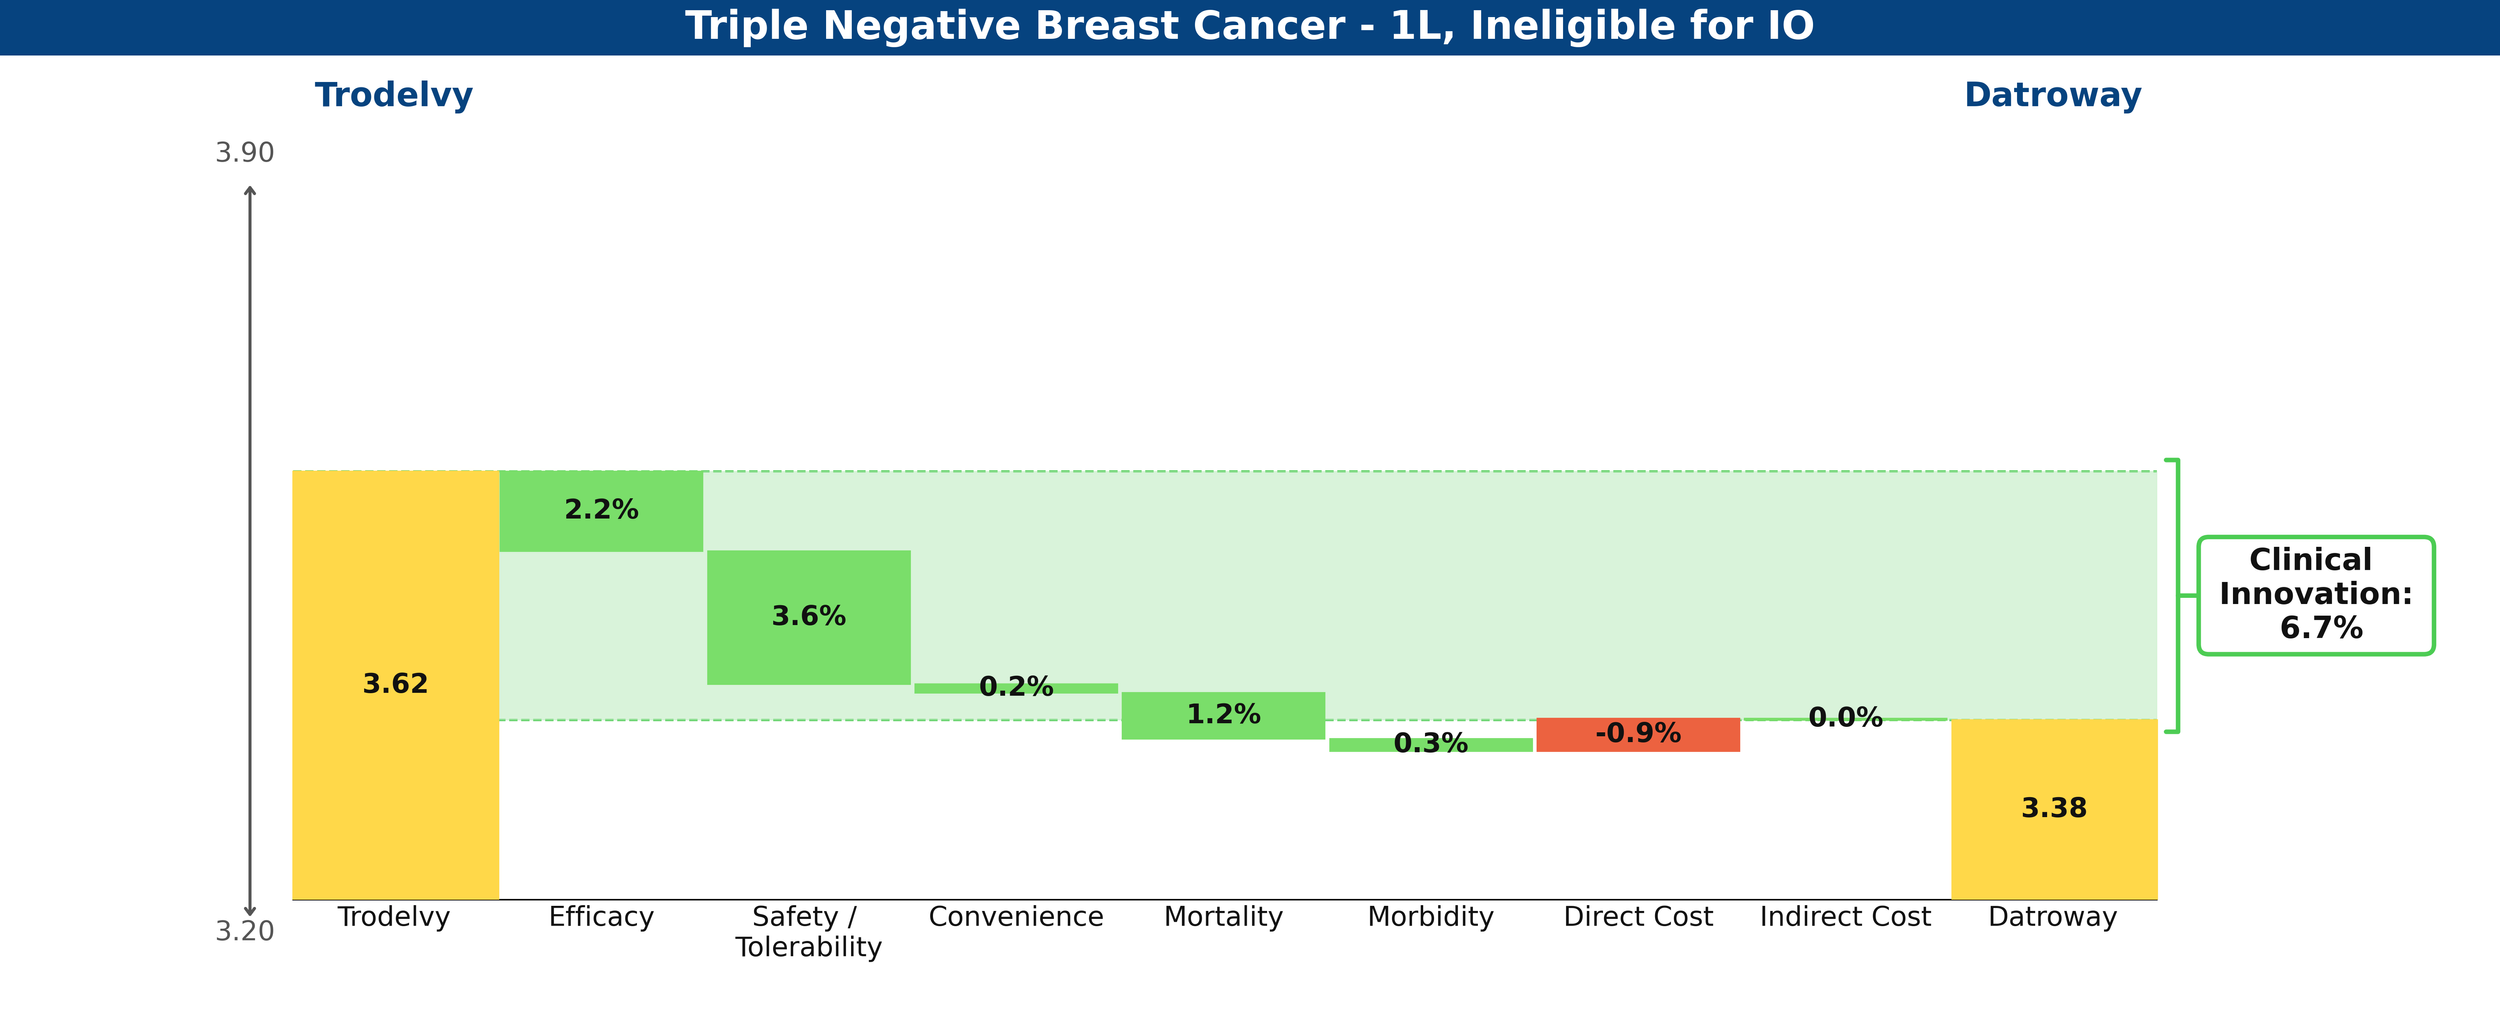
Figure 3: Drivers of Clinical Innovation – Datroway vs. Trodelvy in 1L TNBC ineligible for IO
Trodelvy’s story is rosier in the PD-L1-positive cohort, delivering a 7.2% reduction in unmet medical need when combined with Keytruda, compared to chemotherapy plus Keytruda—a competitive Clinical Innovation score.
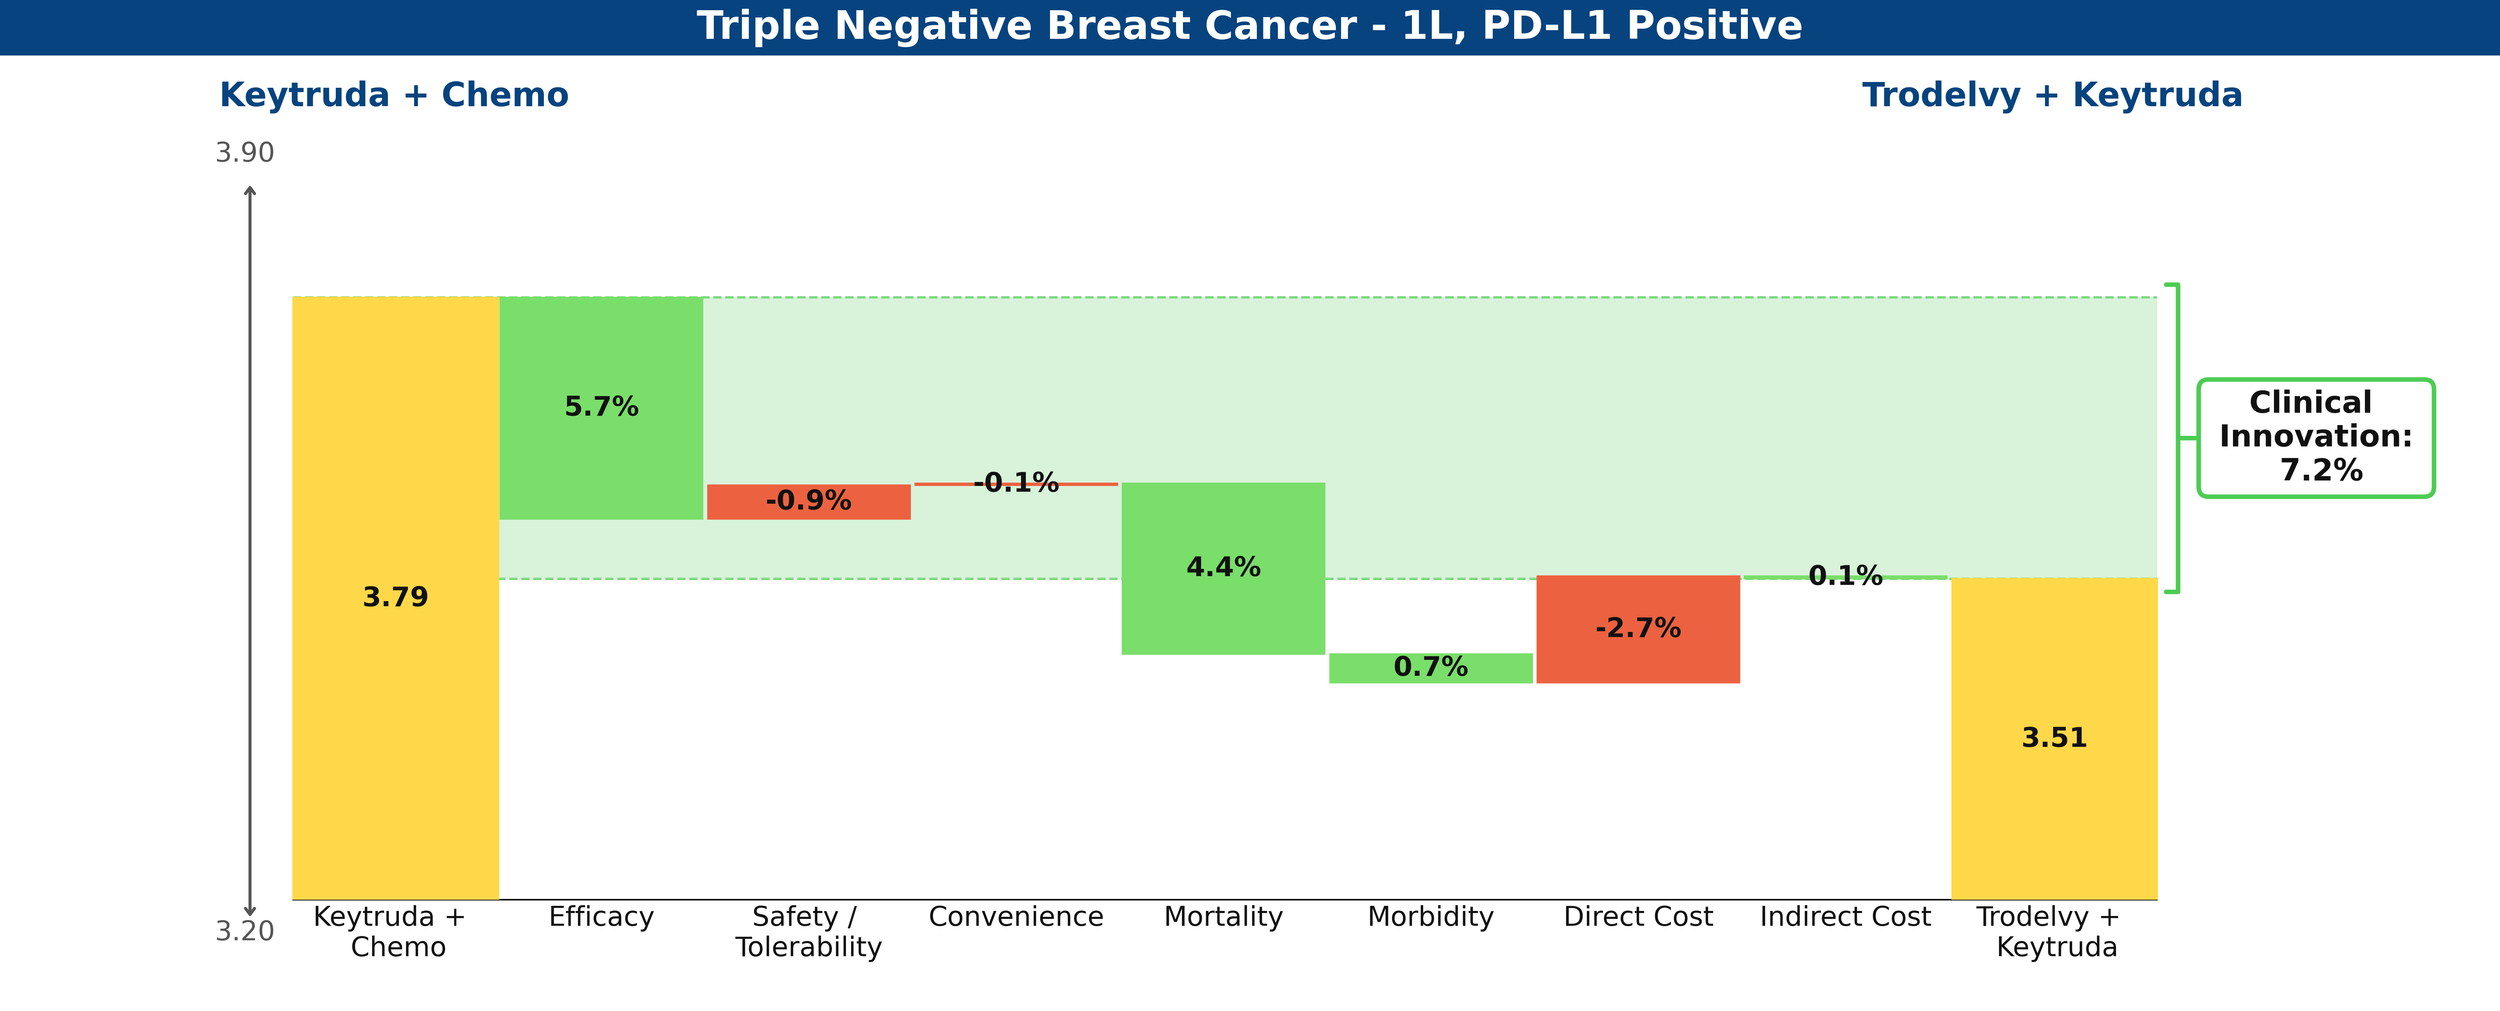
Figure 4: Drivers of Clinical Innovation – Trodelvy in 1L TNBC, PD-L1-positive
Share Prediction
With the innovation scores above and low levels of existing competition, Equinox Group predicts that Datroway could achieve a 56% peak share in the IO-ineligible population and that Trodelvy could achieve a 60% peak share in the PD-L1-positive cohort.
Datroway is currently in clinical development for the treatment of PD-L1-positive 1L TNBC, in combination with AstraZeneca’s in-house PD-L1 inhibitor, Imfinzi (atezolizumab), which to date has no approvals in breast cancer (this trial, TROPION-Breast05 is expected to read out by mid-2027). Both Datroway and Trodelvy are trialing in pre-metastatic TNBC, as well, with Datroway’s trial expecting to read out mid- 2027 and Trodelvy’s by the end of 2028.
What remains for this field is the promise of yet another TROP2 ADC, Merck’s sacituzumab tirumotecan (sac-TMT). In its phase 2 OptiTROP-Breast05 trial, Sac-TMT demonstrated improved response rates over its in-class competitors across the PD-L1 spectrum.
[1] Dent et al. 2026 (TROPION-Breast02)
TP53, the most altered gene in oncology
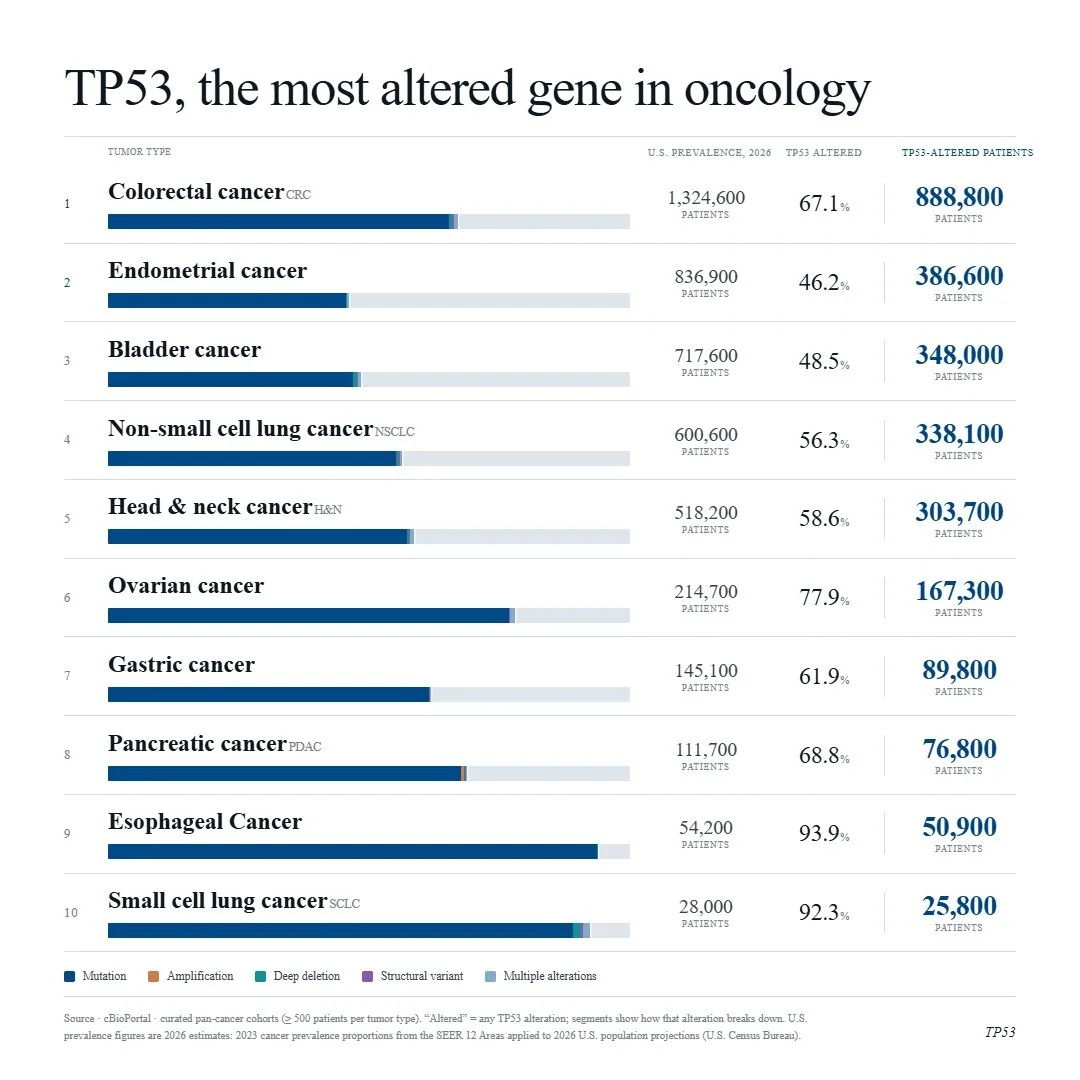
With the evolution of RAS inhibition, ambitions are high and drug developers are looking for the next big target. TP53 is a noble contender, as it is the most altered gene across solid tumors with no approved targeted therapies and little progress made thus far. The RAS pathway spent four decades on the same “undruggable” list as TP53. Now, KRAS G12C inhibitors have been on the market for five years and pan-RAS and allele-specific agents are in development that, together, could address ~90% of pancreatic cancers, representing a major paradigm shift.
Below are cancers with the top 10 percent prevalences of TP53 alteration.
Lifyorli Approved in Platinum-Resistant Ovarian Cancer Thanks to a 35% Reduction in Mortality
Lifyorli (relacorilant, Corcept Therapeutics) received its first approval on March 25th based on the results from the phase 3 ROSELLA trial, which looked at the Corcept agent as an add-on to nab-paclitaxel in platinum-resistant ovarian cancer (PROC) patients who have received prior bevacizumab. [1] These patients have limited treatment options and a mortality rate in the first year of platinum-resistant disease that is 16 times higher than that of their age-matched peers. Recent FDA approvals have emerged in subsets of PROC patients with actionable biomarkers, but little options remain for patients without them. As a result, these patients will typically receive non-platinum chemotherapy, such as paclitaxel, pegylated liposomal doxorubicin, or topotecan. [1]
When added onto nab-paclitaxel, Lifyorli offered over 4 additional months of survival compared with nab-paclitaxel alone. (16.0 vs 11.9, HR = 0.65) [1] This substantial benefit helps to meaningfully address the most substantial unmet need of this disease. However, the regimen did not offer the same magnitude of improvement in progression-free survival and overall response, only scoring one additional month of PFS (6.5 vs 5.5) and not achieving a statistically significant difference in the secondary endpoint of overall response rate (36.9% ORR vs 30.1%, p=0.17). [2] Together, these attributes make up an interesting efficacy profile, as an OS improvement more than 4x the PFS improvement of a given regimen is highly uncommon.
When taking into account the modest drawback of increased side effects, Lifyorli achieves a solid 5.8% clinical innovation when compared to nab-paclitaxel. While this is not a blockbuster score, it is no doubt a meaningful efficacy improvement that will make this drug competitive.
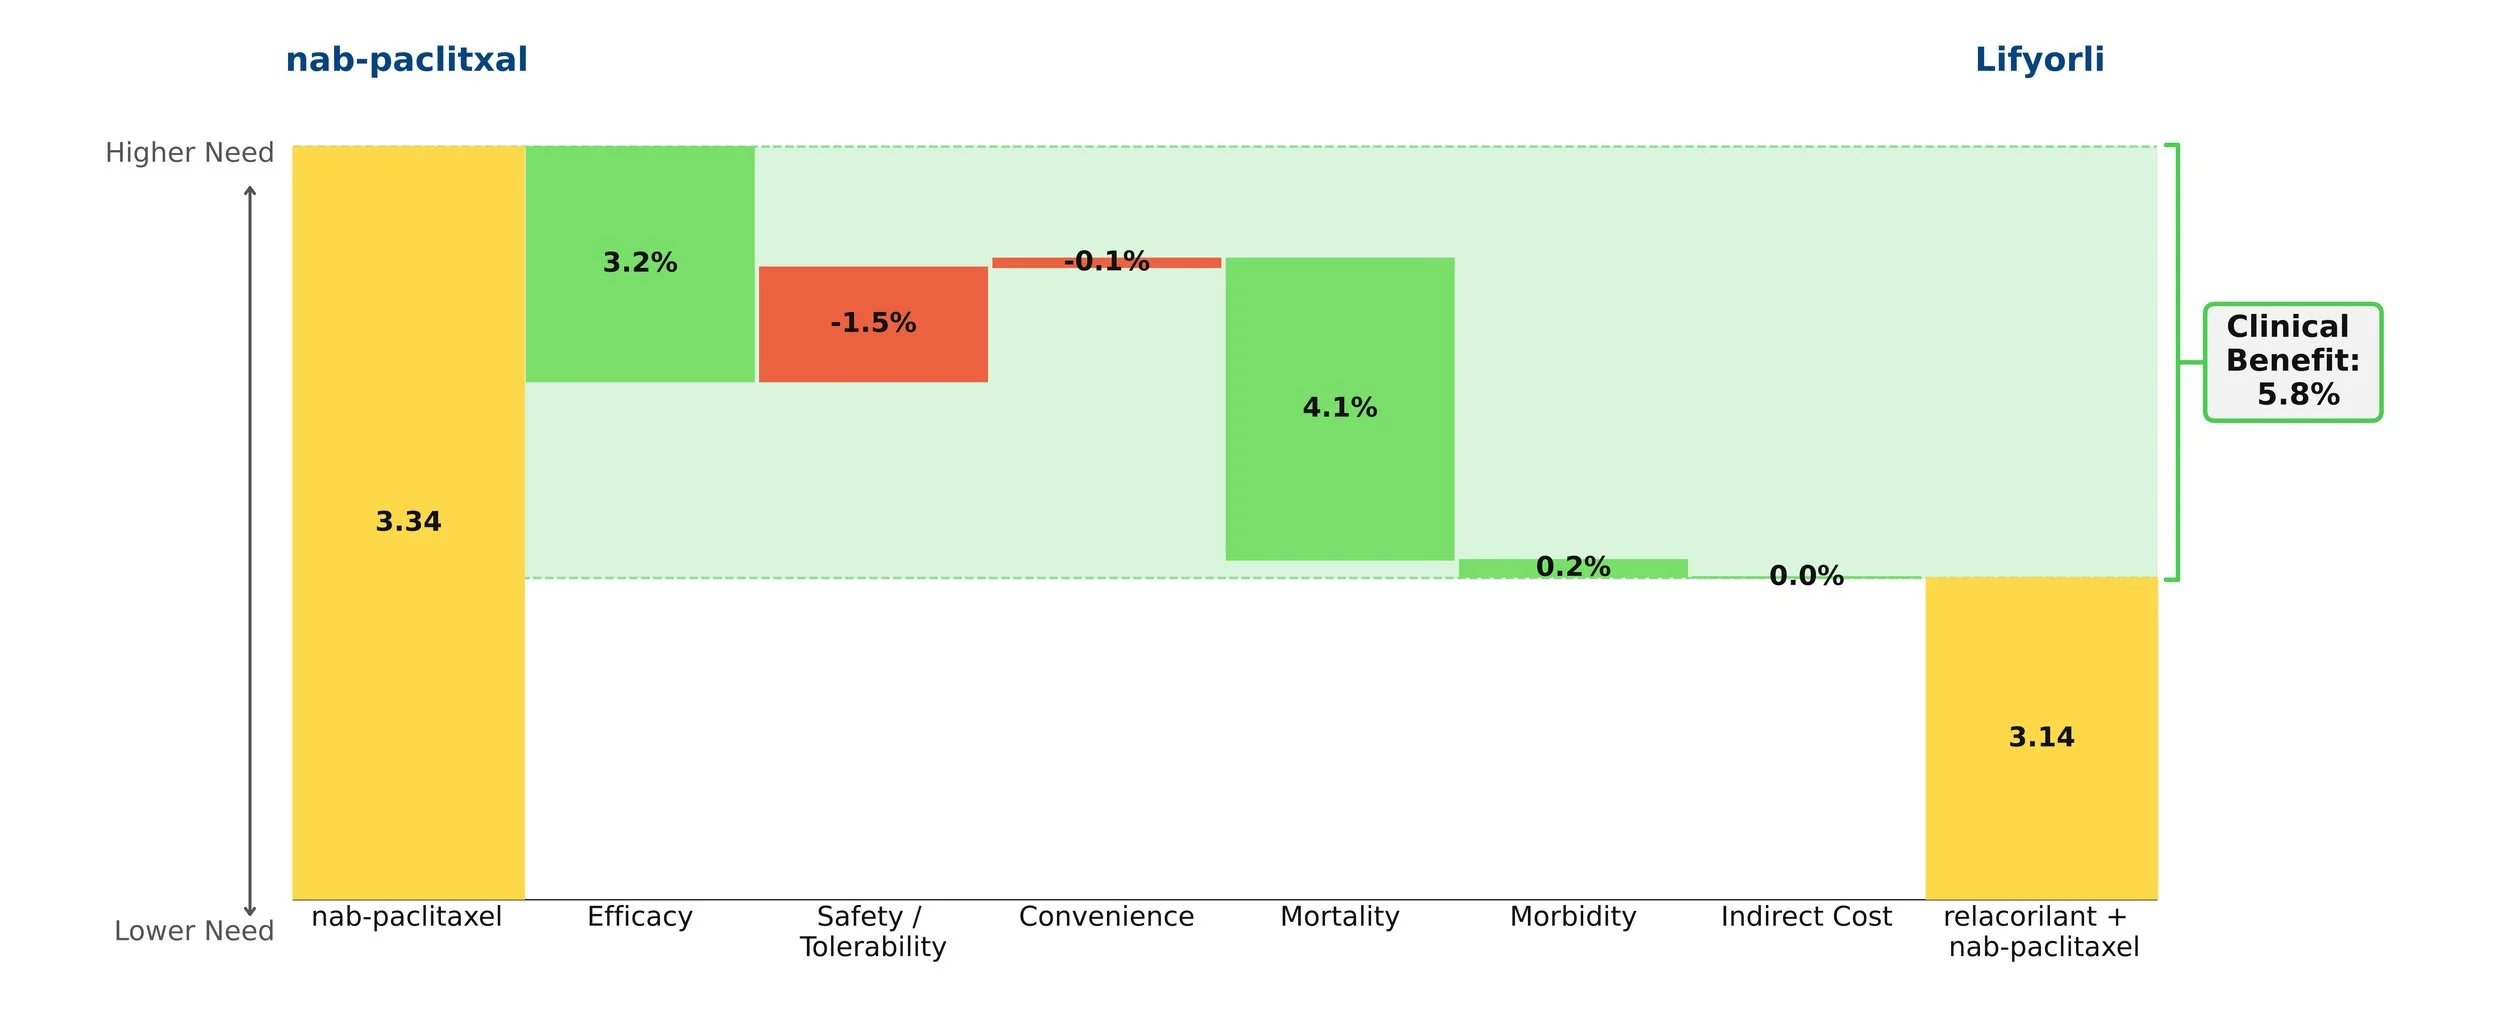
Figure 1: Drivers of Clinical Benefit
Keytruda Grabs its 42nd Approval in PD-L1+ PROC
Keytruda (pembrolizumab, Merck) received its 42nd approval from the FDA this Tuesday, February 10th based on the results from the phase 3 KEYNOTE-B96 trial, which looked at the blockbuster PD-1 inhibitor as an add-on to paclitaxel with or without bevacizumab in PD-L1+ platinum-resistant ovarian cancer (PROC). [1] This subset of ovarian cancer patients has developed resistance to standard platinum-based regimens. As a result, they receive non-platinum chemotherapy, such as paclitaxel, pegylated liposomal doxorubicin, or topotecan.
When compared to paclitaxel +/- bevacizumab, the Keytruda regimen showed improvements in survival, progression, and response while maintaining a comparable safety and convenience profile. Importantly, the mortality benefit is what stole the show: an impressive 30% increase in mOS over paclitaxel +/- bevacizumab (19.2 months vs. 14.0 months). [2]
Taking into account the cost impact of adding on Keytruda, the Clinical Innovation is clawed back slightly to a respectable 5.0% overall (Figure 1). Although Keytruda has seen higher levels of innovation elsewhere, such as its many NSCLC indications, a score of 5% typically suggests market differentiation and shows promise for Keytruda's use in this space.
This Clinical Innovation exhibited by Keytruda will increase in the coming years, as Keytruda is scheduled to lose exclusivity in 2028, which will slightly ease the cost burden.
[1] U.S. Food and Drug Administration. FDA approves pembrolizumab with paclitaxel for platinum-resistant epithelial ovarian, fallopian tube, or primary peritoneal carcinoma. February 10, 2026. Accessed February 12, 2026.
[2] Cortese T. Pembrolizumab combo significantly improves PFS/OS in recurrent PROC. CancerNetwork. October 18, 2025. Accessed February 12, 2026.
How Equinox Group Models Drugs in R&D: The Case of Alecensa in 1L ALK+ NSCLC
We routinely share our view of new drugs coming to the market; for instance, a few months ago, we posted an article detailing top-line results of an analysis of Enhertu in 1L HER2+ metastatic breast cancer.
This article shows in detail how Equinox arrives at a peak share estimate for a new drug treatment, using the example of alectinib (Alecensa, Roche/Genentech) in 1L ALK+ non-small cell lung cancer (NSCLC). Alecensa was approved in this indication 8 years ago; we’ll show how our methodology predicted it would achieve 60% peak share using publicly available data and our Disease Target Assessment framework.
The Framework
Equinox Group’s Disease Target Assessment (DTA) model quantifies the level of medical need in the target population based on peer-reviewed literature. This framework characterizes the adequacy of the current and possible future standards of care (SOCs) to serve as a benchmark for evaluating client product profiles.
We start by characterizing unmet medical need within each defined patient population, quantifying unmet needs in these product attributes:
Efficacy
Safety/tolerability
Dosing
Price
as well as key elements of the burden imposed by the disease:
Mortality
Morbidity (pain, chronic disability, hospitalization, and HRQOL)
Non-drug health care costs
For each domain and subdomain, we use consistent utility functions to derive a score on a 0-5 scale (with 0 representing no unmet need and 5 substantial unmet need). Each domain has a fixed weight based upon its importance, as verified through regression analysis of launched agents. The sum of the weighted scores measures the total unmet medical need for patients treated with the profiled therapy.
Through validation against actual market performance, Equinox has demonstrated that the Clinical Innovation of a new drug (or regimen) offers reliable insight into its ability to compete. A few rules of thumb hold up surprisingly well in projecting a new drug’s commercial outlook:
Drugs with 10%+ Clinical Innovation nearly always dominate their segments – we consider agents with 10%+ Clinical Innovation to be highly innovative
Drugs with Clinical Innovation between 5% and 10% typically achieve good patient share – they are moderately innovative
Drugs with Clinical Innovation below 5% are typically seen as poorly differentiated, especially by payers – these drugs have low innovation
Clinical Innovation and competitive intensity are key drivers of share; our DTA models enter these two inputs into an algorithm derived from a regression analysis of actual market performance to estimate peak-year patient share. Comparing our share predictions to observed peak-year shares, Equinox Group’s oncology-specific regression has a strong R-squared value of 83%.
The DTA methodology is rigorous and dynamic. The Excel-based model we deliver allows for instantaneous updates of inputs and outputs. All sources are well-documented in comments throughout the model, with a bibliographic sources sheet included as well.
Key steps in an Equinox DTA Project
Define the distinct patient population(s) of interest
Characterize disease burden within each patient population
Identify and characterize standard(s) of care
Model the market entrant/TPP
Analyze the developmental pipeline to quantify the expected future level of competition
Estimate the number of addressable patients in the US and key European markets
To support the modeling, Equinox Group also conducts a handful of interviews with academic medical experts to explore their views on pipeline agents, treatment paradigms, and key unmet needs.
The Clinical Sheet
Equinox Group begins by characterizing the key clinical attributes of the SOC(s). We can then use an identical rule set to model client TPPs. For clients who do not yet have any TPPs, we can help model plausible scenarios for profiles.
In 1L ALK+ NSCLC, the SOC prior to alectinib was crizotinib. (Models normally carry two extra slots to model alternative or future SOCs as needed.)
The key clinical domains are shown in the figure below.
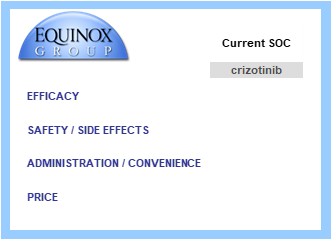
Starting in the efficacy domain, we enter peer-reviewed clinical data for the SOCs. Client TPPs are judged along the same lines. In oncology, key efficacy inputs are:
overall survival,
progression-free survival, and
response rates (partial, complete, and overall)
All inputs are explained in accompanying comments within the Excel file. Academic literature is clearly cited, and any necessary assumptions are explained.

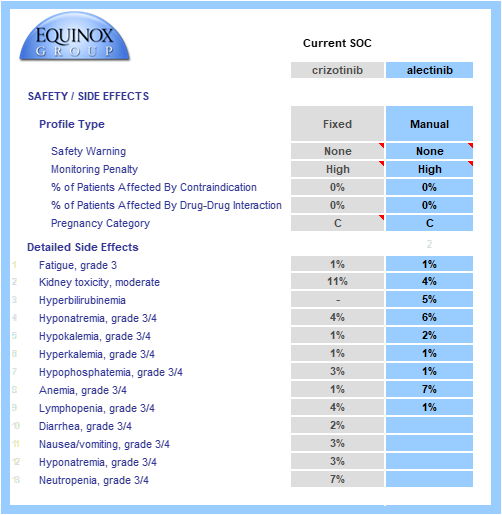
Key safety data are gathered from SOC labels and relevant published trials.
Boxed warnings, frequent or inconvenient patient monitoring, and contraindications and pregnancy warnings (when appropriate) are all taken into account.
Grade 3/4 adverse events are modeled and individually weighted based on their severities (e.g., hyponatremia has a lower impact on unmet need than neutropenia). When substantial adverse event data/hypotheses are available for a TPP, we can model the rates of each event. Alternatively, we can model a simple percentage improvement over a comparator profile (e.g., 20% reduction in the rate of each AE seen in the crizotinib side effect profile). In the example below, full side effect data were available.
The drug or regimen’s convenience score is calculated via a consistent method. Common dosing methods, frequencies, and locations are pre-populated in drop-down menus. The model allows for multi-drug regimens to be modeled, even when combining IV and oral therapies. In this example, each profiled drug is an oral monotherapy.
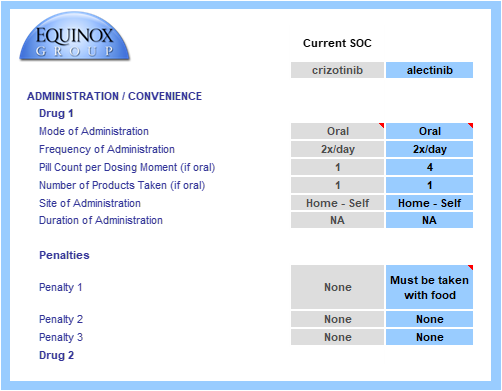
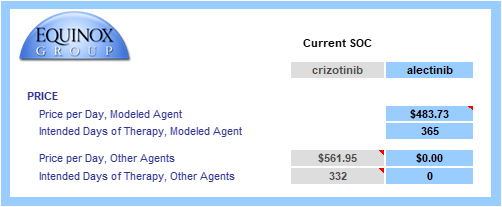
Finally, the drug or regimen’s annual cost is calculated using U.S. WAC pricing. We use WAC values because they allow fair, transparent comparisons and because net prices are not widely visible.
When patients are on treatment for less than one year, the cost calculation is restricted to time on treatment. In the example below, median time to progression is 10.9 months, so only that fraction of the year is entered in “intended days of therapy”.
The Unmet Need Sheet
The data from the Clinical sheet flow into the Unmet Need sheet (see below); the core clinical assumptions each have their own sub-domain under product need.
Equinox Group staff gather peer-reviewed data on disease burden (disease seriousness and disease cost), and the consistent utility functions are applied in Excel.
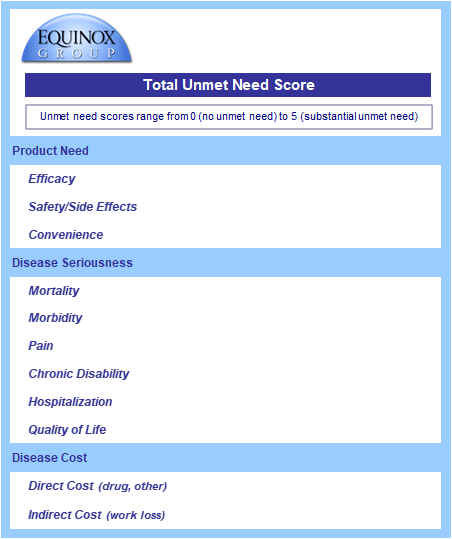
Baseline disease seriousness and costs values come from relevant academic literature, and improvements in efficacy flow through to reduce need in these domains.

In this example, alectinib is more efficacious (thus the lower Efficacy score) and has a cleaner side effect profile than crizotinib. Despite a minor convenience disadvantage, its product need score is significantly lower.
The advantage in overall survival is reflected in a lower mortality score.
Advantages in progression-free survival and response rates reduce morbidity, indirect costs, and non-drug direct costs.
These benefits in indirect and non-drug direct costs partially offset alectinib’s higher price.
The weighted sum of these domain-specific unmet need scores equals a product’s total unmet need score. Overall, total unmet need is lower with alectinib than with crizotinib in 1L ALK+ NSCLC, indicating a better therapeutic option.
Drivers of Innovation
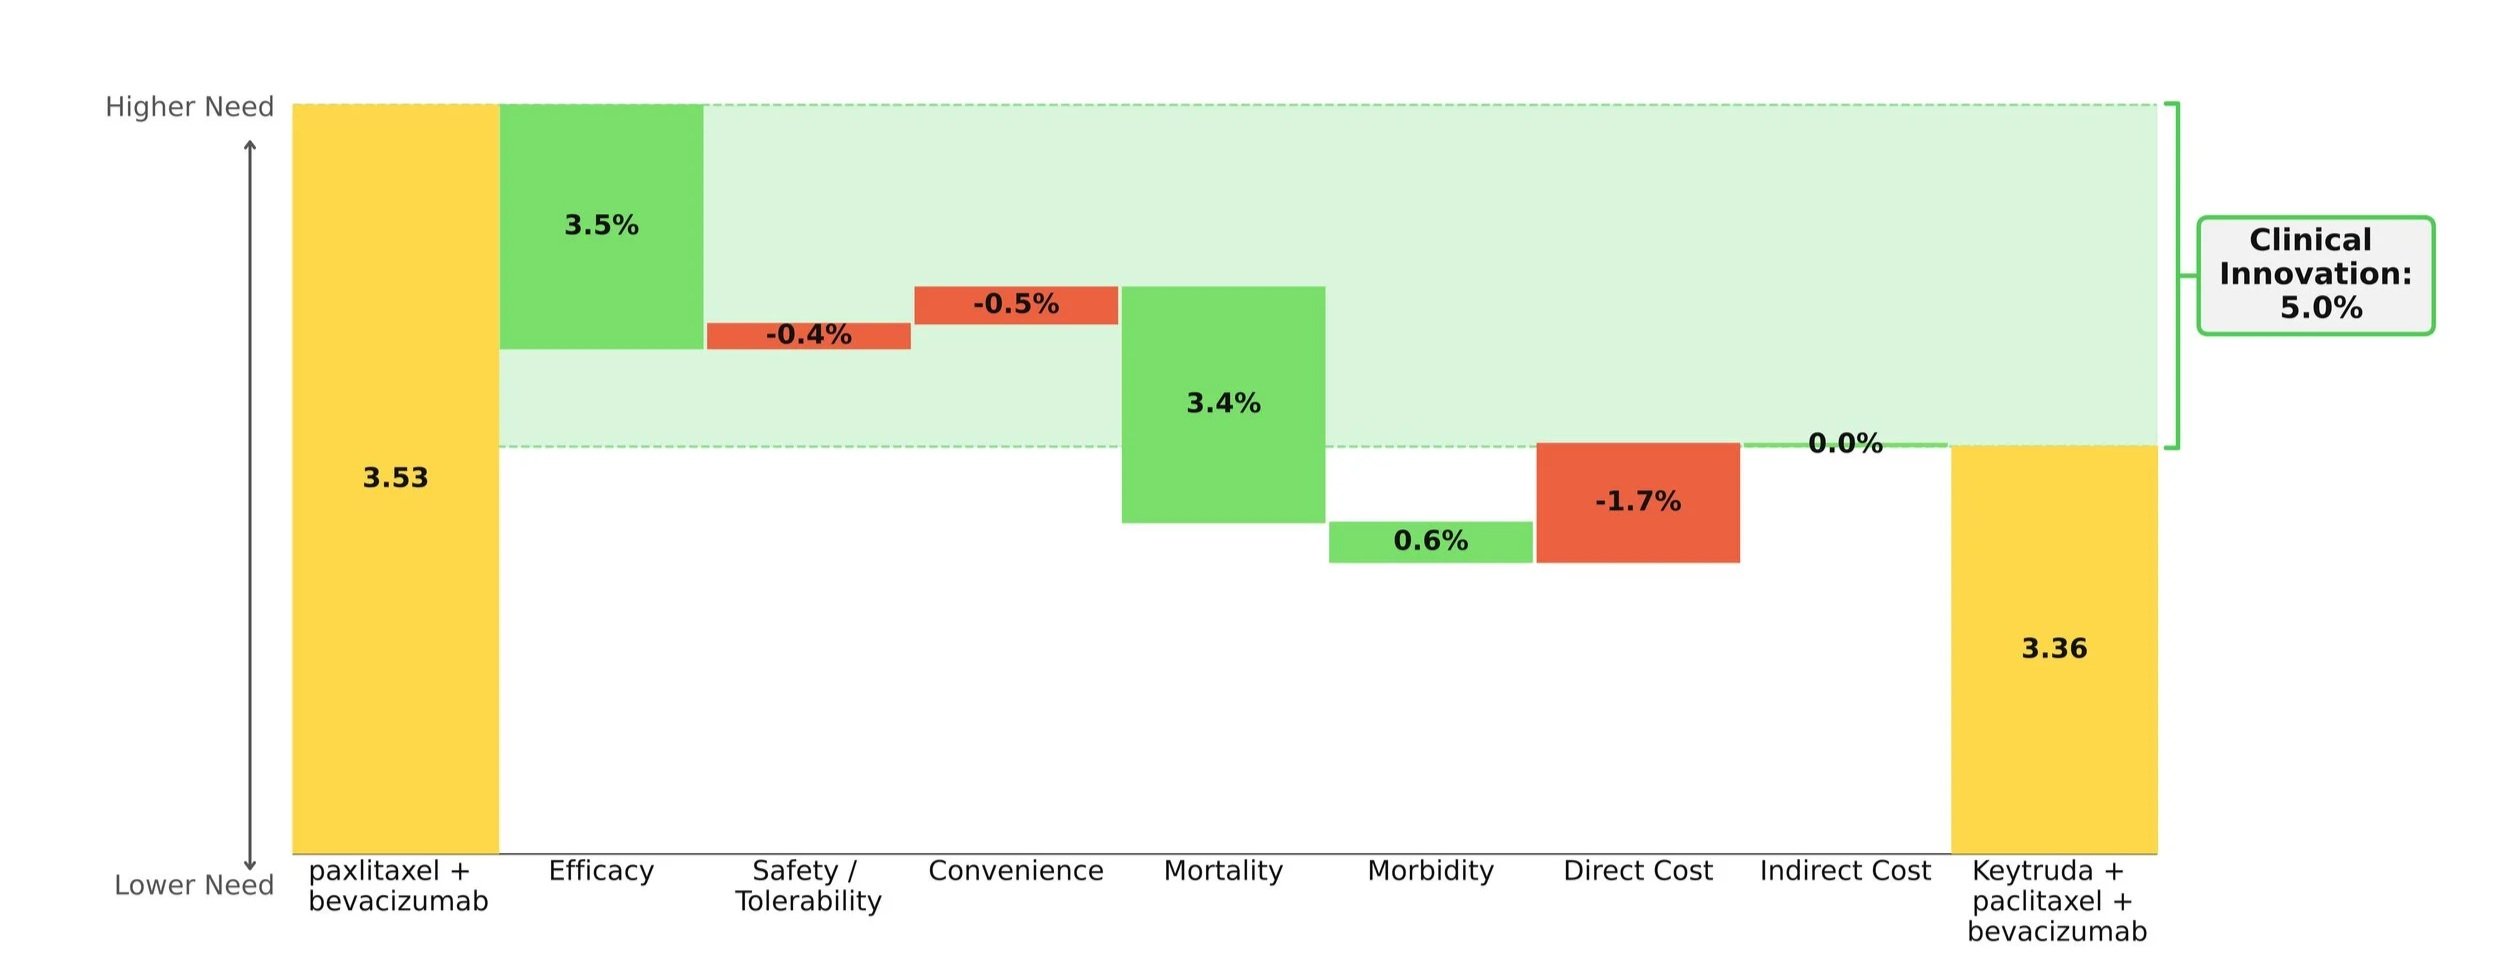
We call the reduction in total unmet medical need is called "Clinical Innovation". We graphically display Clinical Innovation using a Drivers chart.
The gold bars to the left and right of the chart represent the unmet need score under the SOC (crizotinib) and entrant (alectinib), respectively. Scores range from 0-5 with 0 representing no unmet need. As with any waterfall chart, the intermediate green and red bars represent improvements and detriments, respectively, in domain-specific unmet need.

In the above figure, alectinib is shown to reduce total unmet medical need by 23.2%, with more than two-thirds of its improvement coming from efficacy advantages, and its direct cost impact clawing back <1% of its Clinical Innovation. (The percentages on the chart show the contribution of each domain to that 23.2% overall improvement.)
The Clinical Innovation score of 23.2% is highly impressive. Recall our rules of thumb: products with unmet need improvements of >2% are typically commercially viable, >5% are commercially successful (top 3-4 in market), and >10% are market dominators.
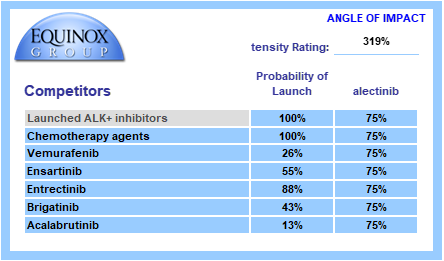
The Competitive Environment
Equinox conducts a thorough review of the developmental pipeline using publicly available sources, such as clinicaltrials.gov and sponsor websites. This pipeline is reviewed by physician experts to ensure nothing is missed, and client competitive intelligence is welcomed.

Each pipeline agent is assigned a probability of launch based upon its phase of development and recent data on success probability by phase and therapeutic area. Competitors are also assigned an angle of impact – how directly (25%-100%) will the entrant and the pipeline agent compete with each other?
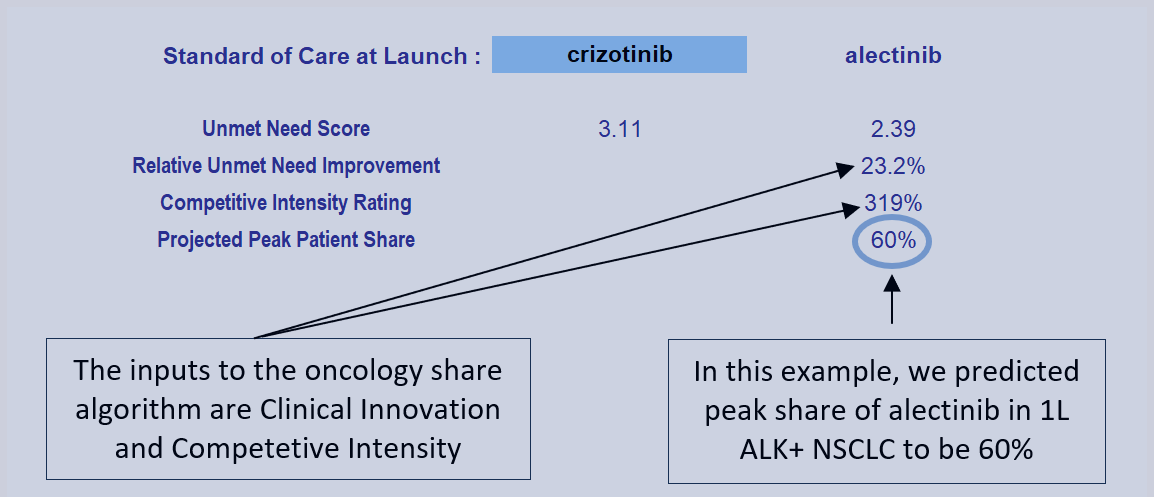
We call the sum product of these factors “Competitive Intensity”, a probabilized headcount of competitors the entrant will face at launch. A competitive intensity rating of 319%, as shown below, is roughly comparable to three direct competitors at launch.
The Commercial Sheet
Seeing a profile’s projected peak-year share is as simple as one click. Selecting the SOC at launch in the blue cell will automatically update the profile’s clinical innovation score which, alongside competitive intensity, are entered into the Equinox Share Predictor. The Commercial sheet also displays key figures such as unmet need scores with the SOC and entrant, diagnosed prevalence of the indication in the U.S., and the annual cost of the profile.
Given a Clinical Innovation score of 23.2% and a competitive intensity rating of 319%, Equinox Group’s regression-validated algorithm projects a peak-year patient share of 60% for alectinib in 1L ALK+ NSCLC.

Each entrant’s share call compares its unmet need score to that of a chosen SOC and factors in the estimated number of competitors at launch. In this example, product attributes for potential new competitors are not evaluated in calculating peak share. As a further product offering, Equinox builds forecasts that capture the impact of competing entrants’ clinical attributes and launch timing to produce realistic forecasts of share over time.
Conclusion
The easy-to-use Excel-based DTA model allows clients to war-game scenarios for input values that aren’t certain yet (such as mature overall survival data) and instantly see how those alternatives affect Clinical Innovation and patient share estimates.
Interested in learning more? Click here to send us a message or to schedule a meeting with one of our practice leaders.
Equinox Group’s proven method to measure clinical innovation and peak-year patient share for new products is accurate, less expensive, more flexible, and quicker to execute than conventional market research-based techniques. We use this approach to inform decisions about individual programs (pipeline and business development), to help therapeutic area teams set aspirations, and to inform R&D portfolio assessments.
A project of this nature typically delivers results in around 6 weeks. We support our models for 24 months from kickoff and can help socialize the methodology and results within your organization.
About Equinox Group
Since 1995, Equinox Group has provided analytics to support R&D decisions at biopharmaceutical firms, assessing the potential of drugs from discovery to launch. Our validated techniques save time and money—and they overcome several deficiencies of traditional demand studies.
We have evaluated thousands of drug profiles across hundreds of indications in oncology, immunology, rare diseases, cardio-metabolic disorders, infectious disease, neurology, pulmonology, urology, ophthalmology, and endocrine disorders. We also have tailored methods to solve the unique analytical challenges that arise in oncology and rare diseases.
Using this methodology, we have developed a suite of tools to inform whatever R&D decisions you’re facing in any stage of development, including: setting indication priorities, supporting go/no-go decisions, assessing market access and pricing potential, share forecasting, and patient flow modeling.
What indications should we focus on?
Drugs with utility across multiple patient populations have the potential to become major cash cows for biopharmaceutical companies. To tap this potential, companies must carefully select which indications to prioritize. This decision can be the difference between establishing a new brand that becomes a pillar of a company’s success and having consistently underperforming sales. The ideal choice is one where high medical need exists in a sizeable population, the asset promises to offer significant improvement, and there is relatively low competition. (Probably no indication checks all of these boxes perfectly.)
Equinox Group provides analytical decision support to development teams making indication prioritization decisions by quantifying these characteristics for each opportunity.
Figure 1 shows how key commercial factors compare across candidate indications for a new oncology therapy, which we call Product X. Perhaps the most important of these—and the hardest to characterize consistently—is the level of improvement the drug would offer over the standard of care (SOC), a chief driver of patient share (more on share below).
We use a rigorous technique to quantify that improvement, which we call “Clinical Innovation”. Using real world market performance, we have observed that the following general rules hold up remarkably well:
Drugs with 10% or greater Clinical Innovation typically dominate their segments
Drugs with 5 to 10% Clinical Innovation achieve good patient share
Drugs with less than 5% Clinical Innovation typically struggle; they impose high risk on the developer

Figure 1: Clinical Innovation, Population Size, and Medical Need: A New Drug in 8 Indications
Product X is highly innovative in 2L CRC (a large population), as well as in 2L TNBC and 1L ALK+ NSCLC. It is also moderately innovative in 1L and 2L melanoma, and 2L pancreatic cancer. In 2L prostate cancer, however, the drug’s Clinical Innovation is well below the 5% threshold, suggesting Product X will be approvable but not be highly competitive in this population. In 3L melanoma, Product X’s Clinical Innovation is slightly below the desired 5% mark, but approval here may be helpful in pursuing 1L and 2L, larger patient segments where Product X is more innovative. These indications have moderate-to-high need at baseline, forming two tight groups on the high end of our unmet need scale.
With all of this in mind, we can transform our view to consider the competitive intensity in each population rather than the level of unmet medical need under the SOC. Below in Figure 2, indications are located by the competitive intensity faced by Product X as well as clinical innovation, with bubble size still indicating patient population size. Note that a lower score on the y-axis implies less competition, meaning that in indications located in the upper right, Product X offers high clinical innovation and has low competition.

Figure 2: Clinical Innovation, Population Size, and Competitive Intensity: A New Drug in 8 Indications
As we can see, the indications are once again separated into two groups: those with moderate competitive intensity (3 to 4 expected direct competitors at launch) and those with higher competitive intensity (5 to 6 competitors).
Additionally, Equinox has developed a regression equation that predicts peak-year patient-share as a function of two of the factors described here; the level of Clinical Innovation and the number of competitors.
Table 1 gathers the key commercial factors presented above into one view, including the corresponding peak-year patient share estimates in the indications.

Table 1: The Complete View
*Undifferentiated from SOC
From our assessment of the clinical innovation in each indication, it is already clear that 1L ALK+ NSCLC, 2L CRC, and 2L TNBC offer good commercial opportunities. But which of them is the best? And what about all the others? Taking into account the other commercial factors, we notice that while 1L ALK+ NSCLC faces moderate competition and has the highest clinical innovation, it ranks as the smallest population with the lowest unmet medical need. Therefore, it’s not going to provide the best revenue potential. Likewise, in 2L TNBC, there is a relatively low barrier to entry and a high unmet need, but the population size also restricts potential gains.
In 2L CRC, the moderate unmet need and large population size make it the best opportunity among the eight indications. While the competitive intensity is high, a clinical innovation of 11.3% should adequately insulate Product X from the competition and results in significant patient share in a sizable population. Due to its size, an initial approval in this indication will potentially help the asset owner manage development costs in the other indications.
These three indications (ALK+ NSCLC, 2L TNBC, and 2L CRC) also have the potential to create a “halo effect” where payers and prescribers view Product X more favorably in other indications due to its previous success. This may prove helpful when pursuing 1L & 2L Melanoma and 2L Pancreatic, all of which are valuable opportunities in this assessment. All things considered, Product X offers substantial revenue and growth potential, if managed properly.
Finally, the analytics described here also include a basis for comparing pricing potential across the candidate indications. To keep this introduction to the techniques brief, we have not included that analysis here, but for those interested in how a pricing potential assessment can be added to the outputs, see this example.
We have fine-tuned these methodologies and others over the past 30 years to help biopharmaceutical companies handle challenges in R&D. Our specialties range from market access and go/no-go decisions to patient share forecasting and patient flow modeling. To learn more about our process, click here to schedule a meeting with one of our practice leaders.
Enhertu is poised to dominate first-line HER2+ breast cancer
Equinox Group’s analysis of the Enhertu + Perjeta combination in first-line HER2+ breast cancer predicts a peak-year patient share of 46% in that setting. Our finding is based on initial results from the Destiny-Breast09[1] trial and the expected competitive environment. FDA approval in first-line is likely by the end of 2025[2].
The core of our analysis compares the net clinical improvement of the Enhertu regimen vs. the current standard of care, Perjeta + Herceptin + paclitaxel. Using our rigorous, data-driven methodology, we find that the Enhertu regimen reduces medical need by 14.6%.
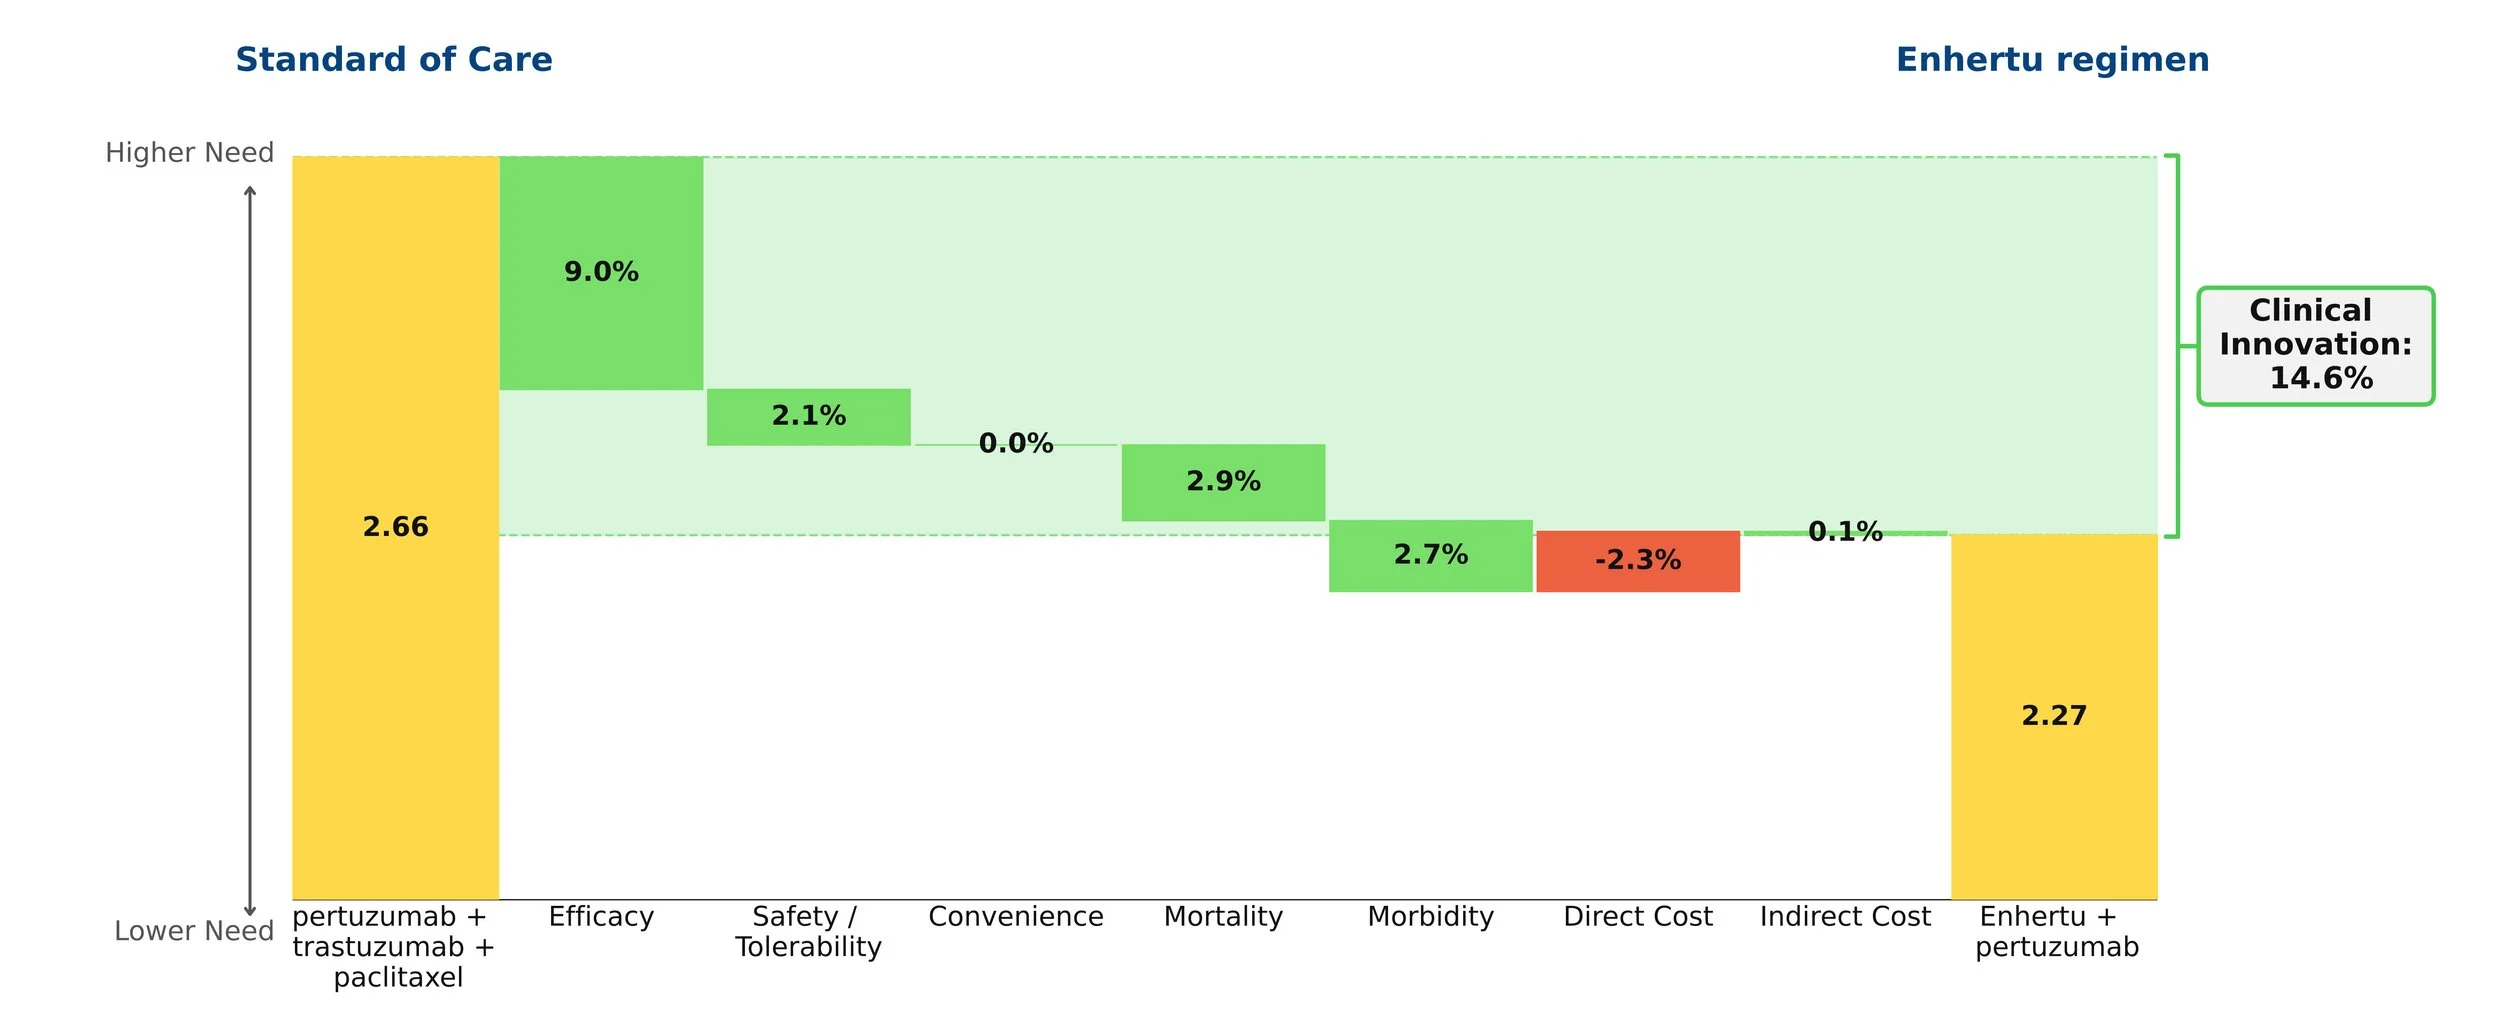
History shows that drugs with a 10% or greater reduction in need typically go on to dominate their segment. Enhertu’s improvement in this population is similar to Tagrisso’s advantage in first-line EGFR+ NSCLC.
The graphic quantifies that net clinical improvement, and shows the contribution of each clinical attribute. The biggest driver is efficacy, primarily progression-free survival (40.7 months for the Enhertu regimen vs. 26.9 months for the SOC). Because the median overall survival data is not yet mature, we have made a conservative assumption about that value for Enhertu. Moreover, the Enhertu regimen spares patients paclitaxel, greatly reducing the frequency of neutropenia and offering a cleaner side effect profile. While the Enhertu regimen costs more, that modest disadvantage is overwhelmed by the clinical benefits.
CAR-T Outlook
Chimeric antigen receptor T-cell (CAR-T) therapies promise to transform treatment of many cancers but have been slow to gain wide use. We argue that the CAR-Ts’ high costs ought to be thought of in light of the many years of life they can add over standard therapy. Even amortizing CAR-T costs over two years puts them in a similar cost-benefit zone as many other highly innovative cancer therapies. Pay-for-performance schemes, such as some being used for CAR-Ts in Europe to reduce payer risk, offer another path to more acceptable costs.
Marketed CAR-Ts are indicated only for hematological malignancies, but there are many developmental programs targeting solid tumors. Moreover, efforts are under way to extend the technology beyond the current autologous approach to include allogeneic solutions, which could ease the cost and complexity of treating with CAR-T therapies.
In this post we analyze the commercial outlook for CAR-Ts, given their unique characteristics, especially:
dramatic clinical improvement (near-cures in approximately 40% of treated patients) and
very high prices (typically north of $400,000 to treat a single patient)
We have analyzed several CAR-T therapies through the lens of our Disease Target Assessment (DTA) framework, which provides (1) an objective and comparable basis for quantifying the magnitude of clinical improvement offered by a therapy, and (2) a measure of clinical benefit compared to price – is the benefit/cost ratio similar to other new oncology drugs that have achieved good market access?
Yescarta
Yescarta (axicabtagene ciloleucel) won its first FDA approval in 2017 and can be considered a moderate commercial success. Its clinical innovation, notably its efficacy, puts it in what has historically been breakthrough territory by our measures. In third-line-plus diffuse large B cell lymphoma (3L+ DLBCL), Yescarta boosted median overall survival to 25.8 months from 6.3 months for Rituxan regimens, with similar improvements in progression-free survival and response rates. Importantly, five-year survival with Yescarta was 42.6%--reflecting a fat tail to the survival curve.
Entering these results and other clinical information in our framework puts Yescarta’s clinical innovation over the Rituxan regimen as 21.5%. This figure is well above the 10% threshold that we observe for new drugs that achieve dominant patient share. Yescarta clearly delivers substantial clinical improvement, on par with other commercially successful new drugs. Yescarta shows nearly identical clinical innovation in the newer 2L+ DLBCL population, suggesting strong share potential in that patient group.
Benefit vs. Cost
To address the question of how a drug’s price affects its outlook, our techniques measure the ratio of “Clinical Benefit” vs. cost; through empirical observation we have shown there is a clear benefit/cost relationship among oncology drugs that have achieved favorable market access (see figure below). Priced upwards of $400K, Yescarta is much more expensive than Rituxan regimens in DLBCL, which average ~$20K annually. CAR-Ts incur substantial ancillary costs for apheresis, bridging therapy, conditioning therapy, infusion and post-infusion, along with hospitalization, ICU stays, and ER visits. Patients with life-threatening adverse events such as high-grade cytokine release syndrome (CRS) incur higher than average costs. All told, the total direct costs of CAR-T therapy can reach ~$650K in DLBCL. In contrast to more conventional drug therapies, all of that cost is incurred up-front.
Because costs are front-loaded while the benefits are durable, we believe these costs should be amortized. We consider a two-year horizon reasonable (i.e., cutting first-year costs in half). Using that assumption, Yescarta’s benefit to cost ratio in 3L+ DLBCL is in line with other novel oncology therapies that have achieved good market access. This is also true for Yescarta in the 2L+ DLBCL population).
Other Approved CAR-Ts
BMS’s Breyanzi has similar clinical characteristics to Yescarta’s in both 3L+ and 2L+ DLBCL, and although launched several years after Yescarta, it is seeing reasonably good uptake. Still more recent is Janssen’s Carvykti in 5L+ multiple myeloma; this agent has even more impressive clinical innovation (40%), and also offers a good clinical benefit to price ratio. Given those results, we think Carvykti will be successful as it gains approvals in earlier lines of therapy.
Barriers to Use
Factors aside from clinical benefit and price also affect CAR-T share. CAR-Ts are only available at authorized treatment centers (ATCs). While there are over 110 ATCs in the United States, their uneven geographical distribution poses challenges. The elapsed time between sampling a patient’s T-cells and reinfusing treated cells limits CAR-T use to patients who have enough time to benefit from it. Ancillary costs are high and may face uncertain reimbursement.
Key Questions Affecting the Outlook for a New CAR-T Program
Equinox conducted this analysis to investigate the extent to which our analytical tools can help development teams anticipate the commercial potential for CAR-T (and other regenerative medicine therapies) programs. Our preliminary conclusion is that the same metrics we have applied for years to more traditional oncology therapies seem to provide similar insight even in the special case of cell therapies. Evidence so far confirms that the level of clinical improvement and its relationship to price remain important factors.
Enhertu shows high clinical innovation in second-line metastatic breast cancer
Conclusion: Enhertu achieves impressive clinical innovation versus Kadcyla, the current SOC, in second-line HER2+ metastatic breast cancer, and in the newly defined HER2-low metastatic breast cancer population at second or later lines of therapy versus chemo.
Enhertu (trastuzumab deruxtecan, AstraZeneca) was approved[1] in December 2019 for HER2+ unresectable or metastatic breast cancer patients who have received multiple prior anti-HER2 treatments. In May 2022 the FDA approved Enhertu in second line HER2+ breast cancer, based on results from the DESTINY-Breast03[2] trial, which show impressive efficacy in the second-line setting in HER2+ unresectable or metastatic breast cancer.

In these patients, Enhertu boasts a significant increase in progression-free survival compared to the current standard of care (SOC), trastuzumab emtansine (Kadcyla) (25.1 vs. 9.6 months), and a notable improvement in overall response rate (79.7% vs. 43.6%). Coupled with a hazard ratio for death of 0.55, Enhertu appears poised to take over from Kadcyla in second-line HER2+ metastatic breast cancer.
The waterfall chart above shows that Enhertu’s improvements in efficacy far outweigh its slightly worse side effect profile when compared to Kadcyla. The jump in efficacy, as well as its trickle-down effect on mortality and morbidity, deliver a strong clinical innovation score of 25.9%. Drugs with clinical innovation above 10% usually dominate their segments; Enhertu’s improvement in this population is similar to Tagrisso’s advantage in second-line EGFR+ NSCLC.
We expect Enhertu to dominate treatment in this setting within two years.
Moreover, the FDA recently granted Enhertu Breakthrough Therapy Designation in patients with unresectable or metastatic HER2-low (IHC 1+ or IHC 2+/ISH-negative) breast cancer who received a prior systemic therapy in the metastatic setting or developed disease recurrence within six months of completing adjuvant chemotherapy. HR+ patients should additionally have received or be ineligible for endocrine therapy.
The DESTINY-Breast04[3] trial studied Enhertu versus investigator’s choice chemotherapy (e.g., eribulin) in 2L+ HER2-low metastatic breast cancer. Enhertu offers a significant increase in progression-free survival (9.9 vs. 5.1 months) and median overall survival (23.4 vs. 16.8 months) compared to chemo, and a dramatic improvement in overall response rate (52.3% vs. 16.3%). This trial could portend a paradigm shift in breast cancer classification, targeting the entirety of HER2 expression.
The waterfall chart below shows that Enhertu’s improvements in efficacy in HER2-low patients, and resultant impact on mortality and morbidity, offer strong clinical innovation of 14% compared to chemotherapy.

Enhertu is a transformative advance for HER2-low metastatic breast cancer patients, and should dominate the space in the near future.
[1] https://www.daiichisankyo.com/media/press_release/detail/index_3159.html