Oncology

Brukinsa: Shooting behind the duck in R/R mantle cell lymphoma

Conclusion: Brukinsa will have a hard time differentiating itself as the third BTK inhibitor to reach market in relapsed/refractory mantle cell lymphoma (R/R MCL).

Brukinsa, developed by the Chinese biotech Beigene, is the most recent BTK inhibitor to earn an indication in R/R MCL. Approved in November of 2019, Brukinsa follows Imbruvica and Calquence to market, with those two enjoying a 6- and 2-year head start, respectively.

Table.JPG

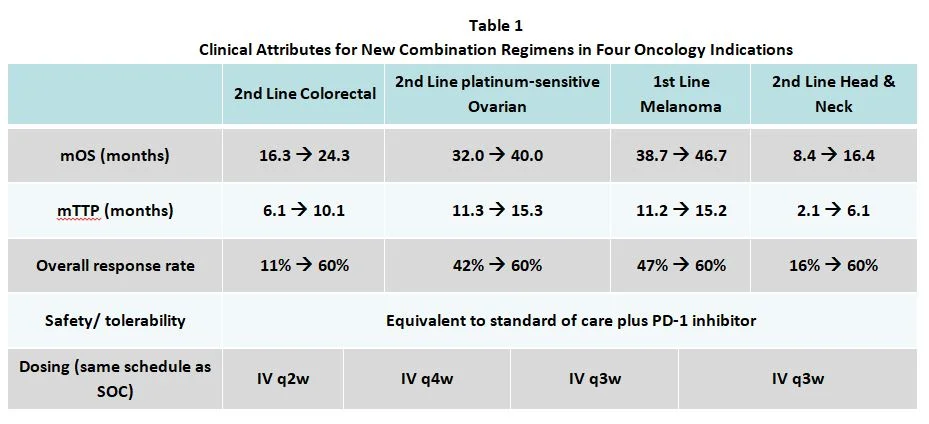
As shown in the clinical characteristics table above, Brukinsa has a marginally better response rate, but an inferior mPFS when compared to up-and-coming Calquence. Equinox’s Unmet Need framework allows us to numerically compare the net clinical advantage/disadvantages these agents offer in this indication.

The figure below illustrates the level of remaining unmet medical need in R/R MCL with each therapeutic option. As shown, Imbruvica was a truly transformative medicine when it was approved in 2013— 22.6% better than Velcade (historically, 10% or more represents strong differentiation).  Calquence offered a further 8% improvement over Imbruvica as measured in our framework (between 5% and 10% is considered medium improvement).  Brukinsa, however, is 6.1% worse than Calquence.  Keep in mind when viewing the graphic below that lower values represent improvement.

We expect Brukinsa to struggle to differentiate itself from the other two BTK inhibitors that beat it to market in this indication, and we believe its weak initial revenue figures are an early indicator of the trying path to success that lies ahead.

Lynparza: Expanding into Prostate Cancer

Conclusion: Lynparza shows significant clinical benefit in its newest indication, second-line HRR-mutated metastatic castration-resistant prostate cancer.  Even when competing against generically priced Zytiga, Lynparza’s efficacy advantages support its current price.

On April 24th, Lynparza (olaparib, AstraZeneca/Merck) announced positive data in second-line homologous recombination repair gene mutated (HRRm) metastatic castration-resistant prostate cancer (mCRPC). Assuming approval, this is the PARP inhibitor’s sixth indication, joining BRCA-mutated pancreatic, ovarian, and breast cancer.

An FDA approval is expected to follow the data published from the PROfound study, a prospective, multicenter, randomized, open-label, Phase III trial testing Lynparza versus enzalutamide or abiraterone in HRRm patients. The trial was broken out into two cohorts, BRCA- and ATM- mutated patients, and other HRR mutations. Lynparza showed significant clinical efficacy over the control arm in both groups, more than doubling progression-free survival (7.8 vs. 3.6 months in HRRm writ-large).  These improvements come to a high-need population—patients with HRR-mutated prostate cancer are on average younger and have more aggressive disease than non-mutated patients.

The waterfall chart below illustrates how Lynparza compares to Zytiga/Xtandi across the different domains of unmet need in HRRm writ-large. Looking at the chart, it’s clear that Lynparza’s efficacy and reduction of mortality offset its higher cost; in the HRRm population the overall improvement as measured by our Clinical Innovation score of 9.1% suggests a well differentiated agent (at the high end of our medium range). In BRCA/ATM mutated patients, Lynparza performs even better, with an overall improvement of 16.6%, which qualifies as high Clinical Innovation.

Drivers website.JPG

We can plot Lynparza’s clinical benefit over Zytiga/Xtandi against its increase in price. Doing so, we see that in both HRRm writ-large (top) and BRCA/ATM mutated (bottom) mCRPC Lynparza falls neatly into the “cloud,” a set of exemplars that have achieved good market access. This is good news for AstraZeneca and Merck— with generic Zytiga now widely available, Lynparza needed to show significant benefit to battle a drug with generic pricing, and it does just that.

Given Lynparza’s significant reduction in overall unmet need in second-line HRRm mCRPC, we expect it to be approved and adopted quickly.

CvB.JPG

Finding the Right Price for a Drug across Multiple Indications; Learnings from Keytruda

Previously, Equinox has described a hypothetical exercise in which a development team attempts to find an optimal price for an agent that is in development in multiple indications.

Here we repeat this exercise with a real-world example, Keytruda.

Keytruda has been approved for a variety of indications.

has described

These indications differ in the size of the addressable patient population (bubble size), the level of unmet need (y axis) and, most importantly, the degree to which Keytruda delivers benefit to patients (x axis).

Finding the right price-per-vial across diverse indications is challenging. Equinox’s analytical tools allow product teams to quantify the value delivered in each population. When we plot the incremental clinical benefit delivered against incremental cost for successful agents, we see the following “cloud” relationship:

CvB without Keytruda and arrows.jpg

Each point represents a new agent in a specific patient population.

Equinox predicts that emerging agents that map within this cloud will receive favorable reimbursement, but agents that land below the cloud risk significant push-back from payers in those indications. Points above the cloud represent indications where the agent is under-priced.

Compared to these exemplars, Keytruda’s various indications map as follows:

CvB with Keytruda.JPG

Keytruda’s price appears appropriate for Gastric, Head and Neck, and Lung Cancer. As a consequence, it offers poor value for money in RCC and Endometrial, and leaves money on the table in HCC and Melanoma. Overall, the price point appears optimized.

Equinox’s analytical tools allow product teams to assess the trade-offs inherent in arriving at a price for any agent in development for multiple indications.

Enhertu: A New Leader in Later-Line Breast Cancer

Conclusion: Enhertu achieves an impressive clinical innovation score for its substantial efficacy improvements over the current SOC (trastuzumab + capecitabine) for adults with HER2+ metastatic breast cancer who have failed multiple prior therapies.

Enhertu (trastuzumab deruxtecan, Daiichi-Sankyo and AstraZeneca) was approved in December 2019 for HER2+ unresectable or metastatic breast cancer patients who have received multiple prior anti-HER2 treatments. It boasts a significant increase in progression-free survival compared to the current standard of care (SOC), trastuzumab + capecitabine (16.4 vs. 5.6 months), as well as a notable improvement in overall response rate (60.9% vs. 22.8%). While survival data is not yet mature, even the most conservative of estimates sees Enhertu winning the day for HER2+ patients eligible for a third or later line of treatment.

The waterfall chart below shows that Enhertu’s improvements in efficacy far outweigh its higher cost and slightly worse side effect profile when compared to the current SOC. The jump in efficacy, as well as its trickle-down effect on mortality and morbidity, deliver a strong clinical innovation score of 26%.

drivers correct.JPG

We expect Enhertu to dominate treatment in this setting within two years. Analysts’ estimates of peak sales around $2.5 billion are reasonable.

PARP Inhibitors: Promise in New Maintenance Indications

Conclusion: PARP inhibitors Zejula and Lynparza both show significant clinical benefit in new maintenance populations in ovarian and pancreatic cancers, respectively. Fortunately for both assets, their clinical benefit in the new indications supports their current prices.

PARP inhibitors are advancing into more indications after their initial approvals in later-line ovarian and breast cancer.  While the cancers that the PARP inhibitors are pursuing differ significantly in unmet need, our analyses suggest that both Zejula and Lynparza are unlikely to encounter market access friction in their latest indications.

Results were recently published for Zejula (niraparib, GlaxoSmithKline) in the maintenance setting for newly diagnosed stage III and IV ovarian cancer patients who respond to platinum-based chemotherapy. Zejula is still awaiting approval in this indication, but there are no maintenance options for most of these patients, leaving a wide window of opportunity. Lynparza (olaparib, AstraZeneca/Merck) is the only PARP inhibitor currently playing in first-line ovarian maintenance, and only for the 15% of patients who have a BRCA mutation. Should Zejula receive its sought-after label expansion, its new maintenance data includes results for both BRCA-positives and “all comers”. Zejula is already approved in both ovarian cancer patients with refractory disease who have homologous recombination deficiencies (HRDs) and in second-line maintenance.

Fortunately for GSK, adding Zejula as maintenance therapy for first-line ovarian cancer patients (regardless of BRCA mutation) offers a tremendous clinical benefit of 39% in our framework, largely driven by improvements in both efficacy and mortality. The benefit is even greater in HRD patients, in whom Zejula provides a 56% clinical benefit.

Zejula Updated.JPG

Like Zejula, AstraZeneca/Merck’s PARP inhibitor, Lynparza, recently sought out and received approval as maintenance therapy in pancreatic cancer patients with a BRCA mutation. This is Lynparza’s fifth approval and the first approved therapy for maintenance following first-line therapy in pancreatic cancer. While BRCA-mutated pancreatic cancer has a smaller overall population than Lynparza’s other indications (ovarian and breast cancer), the low level of competition makes for an attractive opportunity, especially among BRCA-mutated patients.

Lynparza offers a significant clinical benefit of 16.6% as maintenance in BRCA-mutated pancreatic cancer. While it didn’t show a significant survival benefit, Lynparza nearly doubled time to progression from 3.8 months to 7.4 months in a recent phase 3 trial.

Lynparza updated.JPG

Using our Cost vs. Benefit tool, we can plot both Zejula and Lynparza in their respective indications within a historical data set of new oncology drugs that achieved favorable market access. Incremental cost (inverted) is plotted along the y-axis and clinical benefit along the x-axis, showing a clear relationship between clinical benefit in successful therapies and cost.  We believe that drugs that fall within the resulting cloud are priced appropriately given their clinical benefit.

While Zejula and Lynparza are priced slightly higher than other agents offering similar levels of clinical benefit, they are within range of historical analogs.  We consider them appropriately priced in these indications and expect them to receive favorable market access.

U.S. WAC prices are $372/day for Zejula and $472/day for Lynparza.

CvB CORRECT.JPG

While our analysis predicts strong market access for Zejula, the competition for this indication is likely to be fierce. Avastin/Lynparza dual therapy and veliparib monotherapy have both recently released positive results in maintenance clinical trials. Though capturing the market will be no easy feat for GSK, Equinox Group believes Zejula is well positioned to become the market leader. This is largely due to the fact that the PRIMA trial (Zejula maintenance vs placebo) included patients who responded to any chemotherapy regimen, while the trials for Avastin/Lynparza and veliparib maintenance only included patients who received induction with, respectively, Avastin-containing and veliparib-containing regimens, limiting the potential patient populations they can tap into.

Contrastingly, Lynparza faces only one potential competitor, Rubraca (rucaparib, Clovis Oncology). Given the low level of competition and the clinical benefit that Lynparza offers compared to its price, we believe that Lynparza will also achieve considerable market share.

Our analysis incorporated data from the PRIMA, VELIA, PAOLA-1 and POLO trials, as well as prescribing information for Zejula and Lynparza.

Candidate Observations to Be Added to Equinox’s Oncology Normative Pricing Model

Equinox Group has recently analyzed six more observations that are candidates for inclusion in our oncology normative pricing model.  The graphic below shows the new observations (green dots) as a holdout set compared to the original observations (blue dots).  The benefit vs. cost (price) ratios for the new set closely match those in the original set and should provide an even more robust basis for predicting pricing potential for new agents once  incorporated into the next generation of the model in early 2020.

Pale dots: original observation setGreen dots: new candidate observations

Pale dots: original observation set

Green dots: new candidate observations

Background: Equinox Group’s oncology normative pricing model allows drug development teams to estimate the pricing potential of their developmental programs as a function of their anticipated clinical attributes. The model is based on analysis of clinical improvement vs. cost (price) for a set of oncology agents that have achieved favorable market access in recent years. That analysis shows that there is a clear and quantifiable relationship between clinical benefit and cost among successful drugs. Development teams can easily explore how alternative clinical outcomes for an agent will affect its pricing potential in each of its target indications.

Tecentriq and Imfinzi Both Offer Modest Improvements in SCLC

Conclusion: The clinical improvement of Tecentriq (atezolizumab, Roche) in untreated extensive-stage small cell lung cancer is positive, but modest.  New data recently announced for Imfinzi (durvalumab, AstraZeneca) looks about the same.  The impact on incremental cost in this population (driven by the drugs’ prices), however, are not far outside recent historical norms, which suggests both regimens will be reimbursed by payers.

Capture.JPG

Roche’s Tecentriq won FDA approval in March 2019 as the only immuno-oncology therapy for previously untreated extensive-stage small cell lung cancer. AstraZeneca plans on introducing competition soon; in September 2019 the company reported positive results from their Imfinzi study. Each drug was trialed as an add-on to carboplatin plus etopiside. Imfinzi reported slightly higher median overall survival than Tecentriq showed (13.0 vs. 12.3 months).  Unsurprisingly, its overall improvement as measured in Equinox Group’s analytical model is about the same as Tecentriq’s.

Although not negligible, Tecentriq’s and Imfinzi’s clinical innovation scores of 4.7% (shown above) and 5.4%, respectively, leave significant room for improvement in a population with high unmet medical need that includes 11% of all lung cancer patients. These clinical innovation scores are well below those recently achieved in other lung cancer populations, e.g., Keytruda in adNSCLC and sqNSCLC, and Tagrisso in EGFR+ Lung cancer (shown below).

Plotting clinical benefit against cost, the figure below confirms that both drugs offer modest innovation compared to other recent launches, but the incremental cost (prices) for both regimens are not high relative to recent historical norms for new oncology agents that have achieved favorable market access.

CvB.png

Our analysis incorporated data from the CASPIAN and IMpower133 clinical trials and the full prescribing information for Tecentriq and Imfinzi.

Pricing a new oncology agent across multiple indications

If the patients are sick enough, the theory goes, you can charge a lot for your drug.  How much of a difference your drug makes also matters.

Consider an immuno-oncology agent to be added to the current standard of care in each of the four indications listed in Table 1.  The assumed clinical attributes for the new combination regimens are shown.  They include changes in median overall survival (adding 8 months), median time to progression (adding 4 months), response rates, safety/tolerability and dosing.

Capture.JPG

Applying our analytics, we can quantify the disease burden (mortality and morbidity) and the degree of improvement offered in each patient population. This allows an informed comparison with recent successful launches, and we can thus calculate the US WAC “normative price” for the added agent in each target population (second row in Table 2), based on the value delivered.

Capture 2.JPG

The normative prices for the new drug are translated into implied prices per cycle (third row), which in this example range from $2,500 to $11,700. 

These results allow the team to assess the opportunities and inform the clinical and commercial development strategy.  For instance, with a normative price of $63,100 and a large patient population, 2nd line CRC has high revenue potential (this tool also estimates peak-year patient share and revenue).  If this agent’s price were set at its CRC normative per-cycle price ($3,100), then it would also be seen as appropriately priced in 2nd line ovarian, but it would be somewhat expensive in 1st line melanoma, likely leading to downward pricing pressure and a greater likelihood of access limitations there.  It would however be underpriced in 2nd line head and neck cancer (normative = $11,700), leaving money on the table in that smaller population. 

We have used this framework to help clients evaluate pricing potential for new oncology and hematology drugs across as many as 25 candidate indications for a given asset.  Naturally, other factors affect how indications are prioritized: probability of technical success, strategic fit, and the length and cost of late-stage clinical trials.  Having a sound analysis of pricing potential can make for better development decisions, including not only which indications but also which combinations to pursue.    

Contact Equinox Group to see more details about this application of our tools.

Calquence: The price is right

Conclusion: Our Cost vs. Benefit analysis indicates that Calquence is appropriately priced.

Calquence offers moderate clinical benefit compared to Imbruvica, the standard of care in relapsed/refractory mantle cell lymphoma. Calquence delivers a solid efficacy improvement, the effects of which flow through to improved mortality and morbidity. Combine these factors with somewhat favorable side effects and only slightly worse convenience and Calquence makes for a solid upgrade from Imbruvica. Calquence charges about $170,000/ year (WAC price) compared to Imbruvica’s $157,000. Given its level of clinical benefit, it is appropriately priced.

Drivers for Calquence.PNG

Our Cost vs. Benefit tool allows us to plot Calquence within a historical data set of new oncology drugs that have achieved favorable market access. Incremental cost is plotted along the y-axis and clinical benefit along the x-axis. Our historical data set shows a clear relationship between clinical benefit and cost, forming a cloud of data points. In general, drugs that fall within this cloud are priced appropriately given the level of clinical benefit they offer. Calquence lands just barely above the cloud, which means given the level of clinical benefit it provides, it may have been able to warrant a slightly higher price, but is well within the range of historical analogs.

In relapsed/refractory chronic lymphocytic leukemia, Calquence has shown promising 12 month data, but these data are not yet sufficiently mature to allow us to estimate its clinical benefit in that population. We will update our analyses as more mature data becomes available.

Calquence.jpg

How to Price an Oncology Drug

It is widely agreed that drugs should be priced to reflect their value, or clinical benefit.  But how does one measure clinical benefit?  Equinox Group uses a proven method to quantify clinical benefit, derived from our deep experience in assessing unmet medical need.

A new drug’s proposed cost (on Y-axis, inverted scale) should align with its promised clinical benefit (on X-axis) to place it in the “cloud” of successful recent launches.

A new drug’s proposed cost (on Y-axis, inverted scale) should align with its promised clinical benefit (on X-axis) to place it in the “cloud” of successful recent launches.

Locating clinical benefit on a specific scale allows us to examine how benefit is related to drug price in many recent launches that have gained good market access. Our analysis of drugs that have achieved favorable market access shows a clear relationship between cost and benefit. That observation allows us to advise companies on appropriate pricing for their emerging oncology agents.

Our measure of clinical benefit reflects efficacy, safety/tolerability and dosing, and how efficacy affects disease burden – mortality, morbidity, and cost. 

We can model the expected attributes of a new agent against the background of disease burden in a specific patient population to test the clients’ desired price for the asset.   We can plot the results on the graph above to determine if the new drug falls within “the cloud” of successful agents.  If it does, the drug will most likely achieve favorable market access at the desired price. If not, a rethinking of the pricing strategy may be called for. Our analysis can be applied to the US and each of the five major EU countries, and the same framework can deliver estimates of peak-year patient share and revenue.

Clinical benefit and drug cost vary by patient segment because of duration of treatment, disease seriousness, and a host of other factors, so we analyze each target indication separately. That way, agents with potential in multiple populations can be analyzed in each indication to find the optimizing price for the asset across the board.