

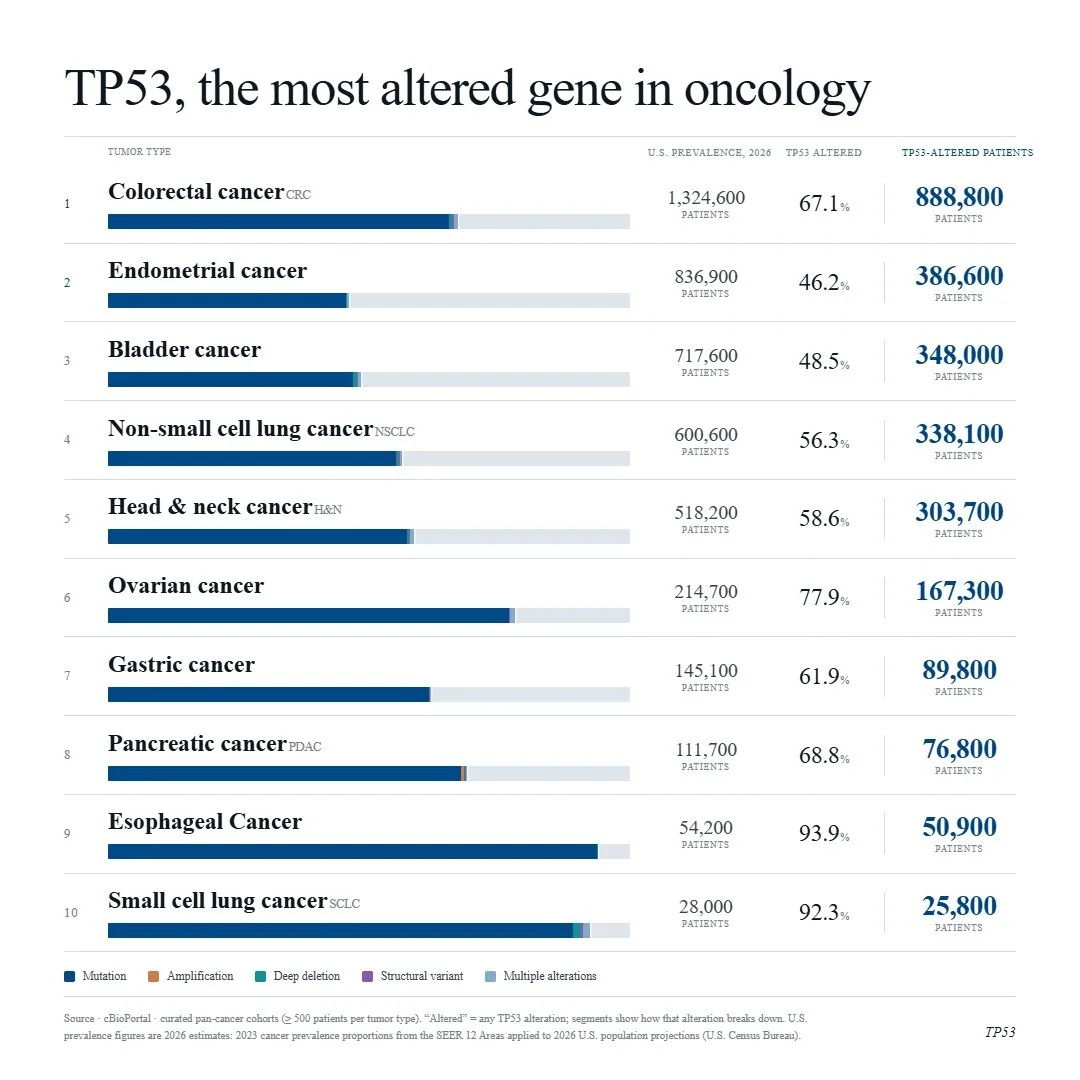
With the evolution of RAS inhibition, ambitions are high and drug developers are looking for the next big target. TP53 is a noble contender, as it is the most altered gene across solid tumors with no approved targeted therapies and little progress made thus far. The RAS pathway spent four decades on the same “undruggable” list as TP53. Now, KRAS G12C inhibitors have been on the market for five years and pan-RAS and allele-specific agents are in development that, together, could address ~90% of pancreatic cancers, representing a major paradigm shift.
Below are cancers with the top 10 percent prevalences of TP53 alteration.
Lifyorli Approved in Platinum-Resistant Ovarian Cancer Thanks to a 35% Reduction in Mortality
Lifyorli (relacorilant, Corcept Therapeutics) received its first approval on March 25th based on the results from the phase 3 ROSELLA trial, which looked at the Corcept agent as an add-on to nab-paclitaxel in platinum-resistant ovarian cancer (PROC) patients who have received prior bevacizumab. [1] These patients have limited treatment options and a mortality rate in the first year of platinum-resistant disease that is 16 times higher than that of their age-matched peers. Recent FDA approvals have emerged in subsets of PROC patients with actionable biomarkers, but little options remain for patients without them. As a result, these patients will typically receive non-platinum chemotherapy, such as paclitaxel, pegylated liposomal doxorubicin, or topotecan. [1]
When added onto nab-paclitaxel, Lifyorli offered over 4 additional months of survival compared with nab-paclitaxel alone. (16.0 vs 11.9, HR = 0.65) [1] This substantial benefit helps to meaningfully address the most substantial unmet need of this disease. However, the regimen did not offer the same magnitude of improvement in progression-free survival and overall response, only scoring one additional month of PFS (6.5 vs 5.5) and not achieving a statistically significant difference in the secondary endpoint of overall response rate (36.9% ORR vs 30.1%, p=0.17). [2] Together, these attributes make up an interesting efficacy profile, as an OS improvement more than 4x the PFS improvement of a given regimen is highly uncommon.
When taking into account the modest drawback of increased side effects, Lifyorli achieves a solid 5.8% clinical innovation when compared to nab-paclitaxel. While this is not a blockbuster score, it is no doubt a meaningful efficacy improvement that will make this drug competitive.
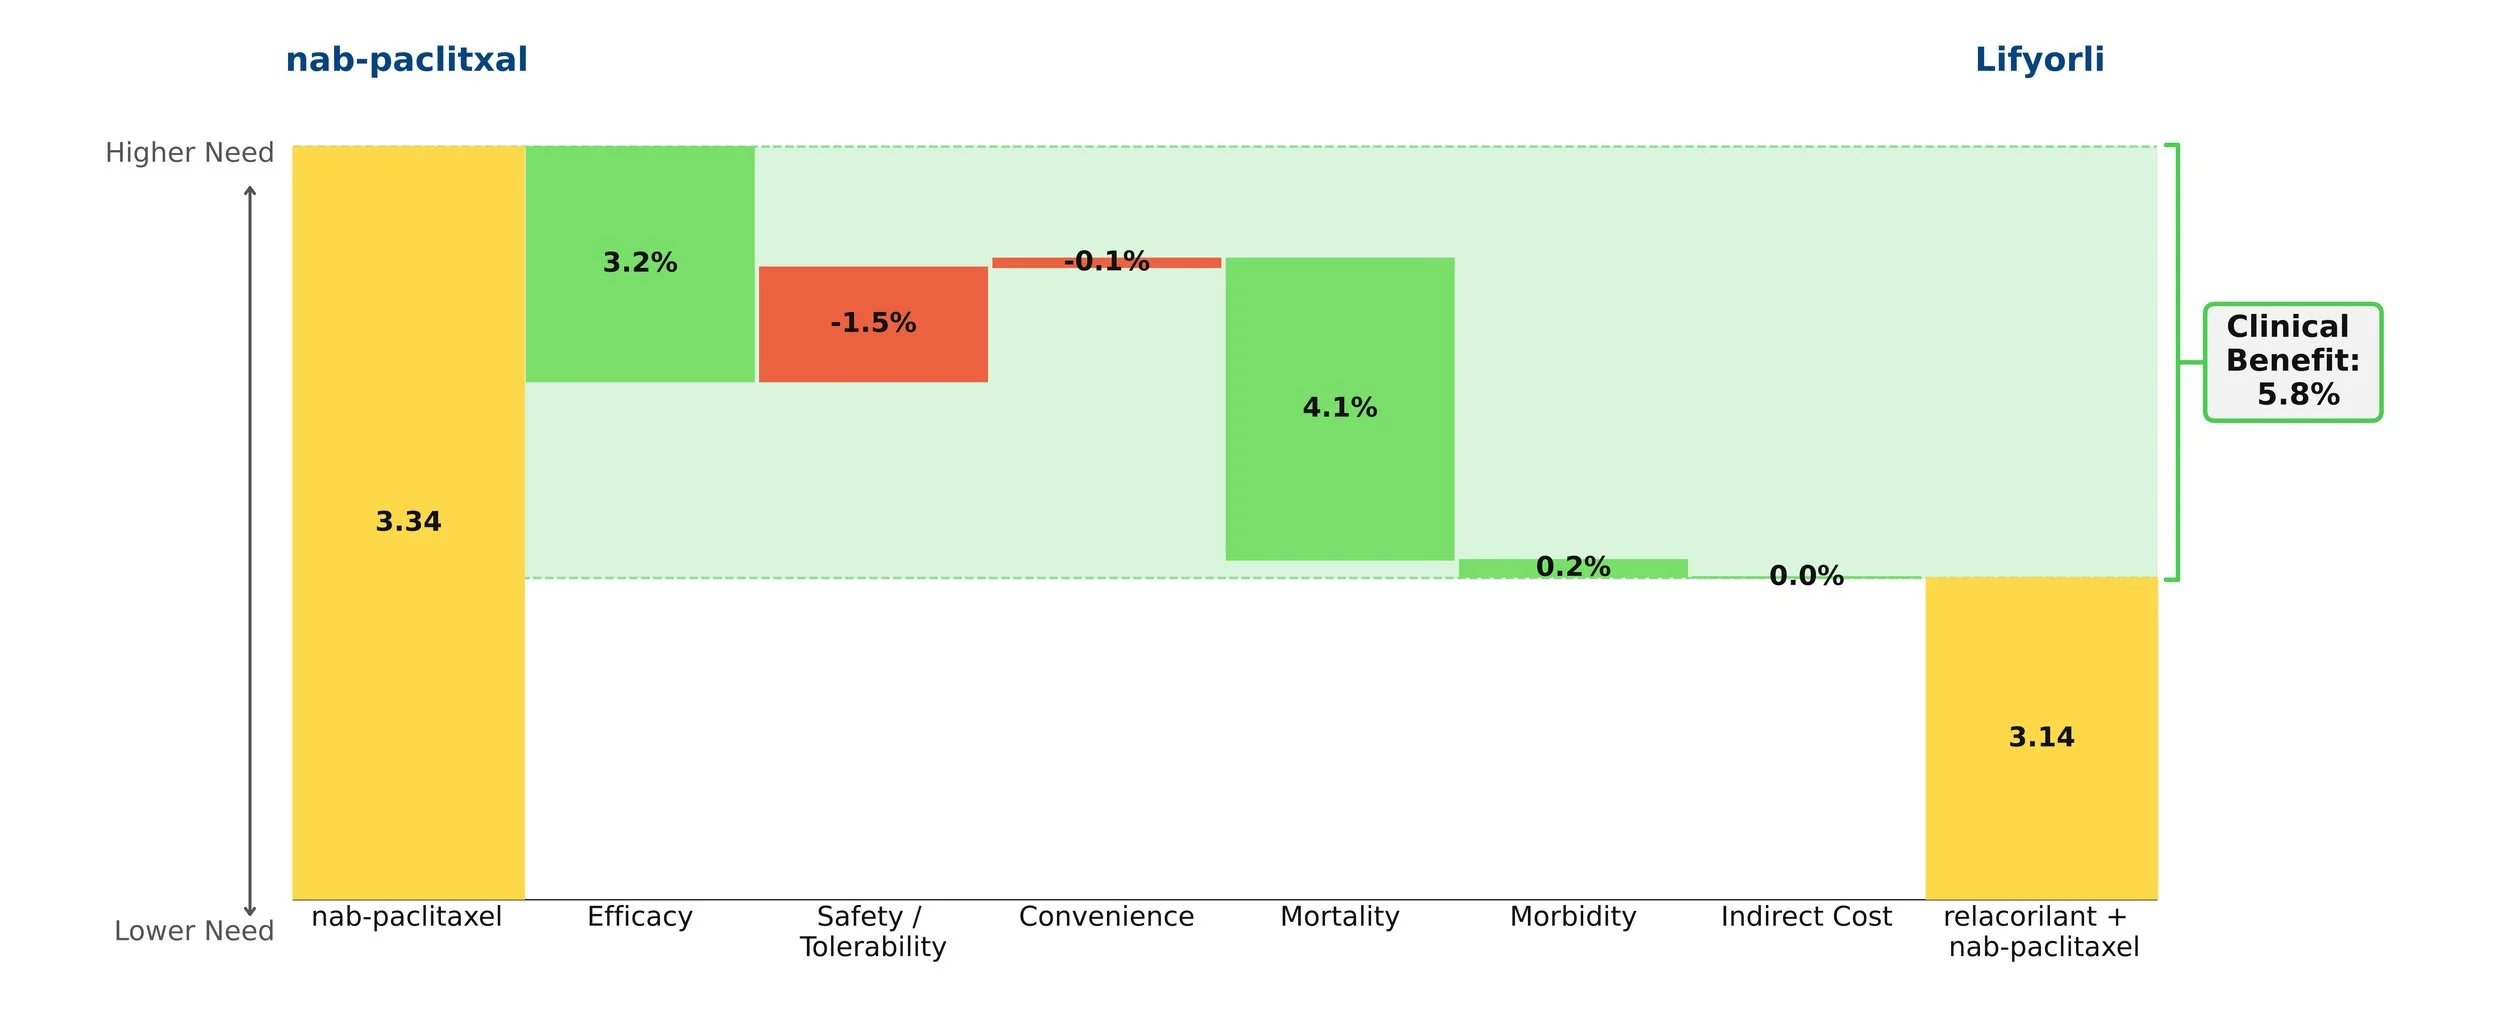
Figure 1: Drivers of Clinical Benefit
What indications should we focus on?
Drugs with utility across multiple patient populations have the potential to become major cash cows for biopharmaceutical companies. To tap this potential, companies must carefully select which indications to prioritize. This decision can be the difference between establishing a new brand that becomes a pillar of a company’s success and having consistently underperforming sales. The ideal choice is one where high medical need exists in a sizeable population, the asset promises to offer significant improvement, and there is relatively low competition. (Probably no indication checks all of these boxes perfectly.)
Equinox Group provides analytical decision support to development teams making indication prioritization decisions by quantifying these characteristics for each opportunity.
Figure 1 shows how key commercial factors compare across candidate indications for a new oncology therapy, which we call Product X. Perhaps the most important of these—and the hardest to characterize consistently—is the level of improvement the drug would offer over the standard of care (SOC), a chief driver of patient share (more on share below).
We use a rigorous technique to quantify that improvement, which we call “Clinical Innovation”. Using real world market performance, we have observed that the following general rules hold up remarkably well:
Drugs with 10% or greater Clinical Innovation typically dominate their segments
Drugs with 5 to 10% Clinical Innovation achieve good patient share
Drugs with less than 5% Clinical Innovation typically struggle; they impose high risk on the developer

Figure 1: Clinical Innovation, Population Size, and Medical Need: A New Drug in 8 Indications
Product X is highly innovative in 2L CRC (a large population), as well as in 2L TNBC and 1L ALK+ NSCLC. It is also moderately innovative in 1L and 2L melanoma, and 2L pancreatic cancer. In 2L prostate cancer, however, the drug’s Clinical Innovation is well below the 5% threshold, suggesting Product X will be approvable but not be highly competitive in this population. In 3L melanoma, Product X’s Clinical Innovation is slightly below the desired 5% mark, but approval here may be helpful in pursuing 1L and 2L, larger patient segments where Product X is more innovative. These indications have moderate-to-high need at baseline, forming two tight groups on the high end of our unmet need scale.
With all of this in mind, we can transform our view to consider the competitive intensity in each population rather than the level of unmet medical need under the SOC. Below in Figure 2, indications are located by the competitive intensity faced by Product X as well as clinical innovation, with bubble size still indicating patient population size. Note that a lower score on the y-axis implies less competition, meaning that in indications located in the upper right, Product X offers high clinical innovation and has low competition.

Figure 2: Clinical Innovation, Population Size, and Competitive Intensity: A New Drug in 8 Indications
As we can see, the indications are once again separated into two groups: those with moderate competitive intensity (3 to 4 expected direct competitors at launch) and those with higher competitive intensity (5 to 6 competitors).
Additionally, Equinox has developed a regression equation that predicts peak-year patient-share as a function of two of the factors described here; the level of Clinical Innovation and the number of competitors.
Table 1 gathers the key commercial factors presented above into one view, including the corresponding peak-year patient share estimates in the indications.

Table 1: The Complete View
*Undifferentiated from SOC
From our assessment of the clinical innovation in each indication, it is already clear that 1L ALK+ NSCLC, 2L CRC, and 2L TNBC offer good commercial opportunities. But which of them is the best? And what about all the others? Taking into account the other commercial factors, we notice that while 1L ALK+ NSCLC faces moderate competition and has the highest clinical innovation, it ranks as the smallest population with the lowest unmet medical need. Therefore, it’s not going to provide the best revenue potential. Likewise, in 2L TNBC, there is a relatively low barrier to entry and a high unmet need, but the population size also restricts potential gains.
In 2L CRC, the moderate unmet need and large population size make it the best opportunity among the eight indications. While the competitive intensity is high, a clinical innovation of 11.3% should adequately insulate Product X from the competition and results in significant patient share in a sizable population. Due to its size, an initial approval in this indication will potentially help the asset owner manage development costs in the other indications.
These three indications (ALK+ NSCLC, 2L TNBC, and 2L CRC) also have the potential to create a “halo effect” where payers and prescribers view Product X more favorably in other indications due to its previous success. This may prove helpful when pursuing 1L & 2L Melanoma and 2L Pancreatic, all of which are valuable opportunities in this assessment. All things considered, Product X offers substantial revenue and growth potential, if managed properly.
Finally, the analytics described here also include a basis for comparing pricing potential across the candidate indications. To keep this introduction to the techniques brief, we have not included that analysis here, but for those interested in how a pricing potential assessment can be added to the outputs, see this example.
We have fine-tuned these methodologies and others over the past 30 years to help biopharmaceutical companies handle challenges in R&D. Our specialties range from market access and go/no-go decisions to patient share forecasting and patient flow modeling. To learn more about our process, click here to schedule a meeting with one of our practice leaders.