

We routinely share our view of new drugs coming to the market; for instance, a few months ago, we posted an article detailing top-line results of an analysis of Enhertu in 1L HER2+ metastatic breast cancer.
This article shows in detail how Equinox arrives at a peak share estimate for a new drug treatment, using the example of alectinib (Alecensa, Roche/Genentech) in 1L ALK+ non-small cell lung cancer (NSCLC). Alecensa was approved in this indication 8 years ago; we’ll show how our methodology predicted it would achieve 60% peak share using publicly available data and our Disease Target Assessment framework.
The Framework
Equinox Group’s Disease Target Assessment (DTA) model quantifies the level of medical need in the target population based on peer-reviewed literature. This framework characterizes the adequacy of the current and possible future standards of care (SOCs) to serve as a benchmark for evaluating client product profiles.
We start by characterizing unmet medical need within each defined patient population, quantifying unmet needs in these product attributes:
Efficacy
Safety/tolerability
Dosing
Price
as well as key elements of the burden imposed by the disease:
Mortality
Morbidity (pain, chronic disability, hospitalization, and HRQOL)
Non-drug health care costs
For each domain and subdomain, we use consistent utility functions to derive a score on a 0-5 scale (with 0 representing no unmet need and 5 substantial unmet need). Each domain has a fixed weight based upon its importance, as verified through regression analysis of launched agents. The sum of the weighted scores measures the total unmet medical need for patients treated with the profiled therapy.
Through validation against actual market performance, Equinox has demonstrated that the Clinical Innovation of a new drug (or regimen) offers reliable insight into its ability to compete. A few rules of thumb hold up surprisingly well in projecting a new drug’s commercial outlook:
Drugs with 10%+ Clinical Innovation nearly always dominate their segments – we consider agents with 10%+ Clinical Innovation to be highly innovative
Drugs with Clinical Innovation between 5% and 10% typically achieve good patient share – they are moderately innovative
Drugs with Clinical Innovation below 5% are typically seen as poorly differentiated, especially by payers – these drugs have low innovation
Clinical Innovation and competitive intensity are key drivers of share; our DTA models enter these two inputs into an algorithm derived from a regression analysis of actual market performance to estimate peak-year patient share. Comparing our share predictions to observed peak-year shares, Equinox Group’s oncology-specific regression has a strong R-squared value of 83%.
The DTA methodology is rigorous and dynamic. The Excel-based model we deliver allows for instantaneous updates of inputs and outputs. All sources are well-documented in comments throughout the model, with a bibliographic sources sheet included as well.
Key steps in an Equinox DTA Project
Define the distinct patient population(s) of interest
Characterize disease burden within each patient population
Identify and characterize standard(s) of care
Model the market entrant/TPP
Analyze the developmental pipeline to quantify the expected future level of competition
Estimate the number of addressable patients in the US and key European markets
To support the modeling, Equinox Group also conducts a handful of interviews with academic medical experts to explore their views on pipeline agents, treatment paradigms, and key unmet needs.
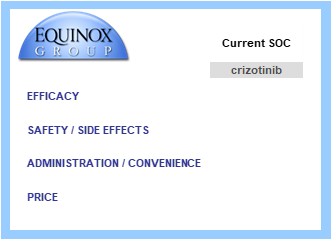
The Clinical Sheet
Equinox Group begins by characterizing the key clinical attributes of the SOC(s). We can then use an identical rule set to model client TPPs. For clients who do not yet have any TPPs, we can help model plausible scenarios for profiles.
In 1L ALK+ NSCLC, the SOC prior to alectinib was crizotinib. (Models normally carry two extra slots to model alternative or future SOCs as needed.)
The key clinical domains are shown in the figure below.
Starting in the efficacy domain, we enter peer-reviewed clinical data for the SOCs. Client TPPs are judged along the same lines. In oncology, key efficacy inputs are:
overall survival,
progression-free survival, and
response rates (partial, complete, and overall)
All inputs are explained in accompanying comments within the Excel file. Academic literature is clearly cited, and any necessary assumptions are explained.

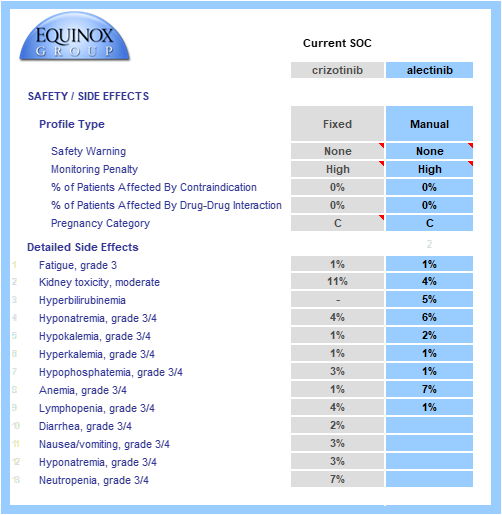
Key safety data are gathered from SOC labels and relevant published trials.
Boxed warnings, frequent or inconvenient patient monitoring, and contraindications and pregnancy warnings (when appropriate) are all taken into account.
Grade 3/4 adverse events are modeled and individually weighted based on their severities (e.g., hyponatremia has a lower impact on unmet need than neutropenia). When substantial adverse event data/hypotheses are available for a TPP, we can model the rates of each event. Alternatively, we can model a simple percentage improvement over a comparator profile (e.g., 20% reduction in the rate of each AE seen in the crizotinib side effect profile). In the example below, full side effect data were available.
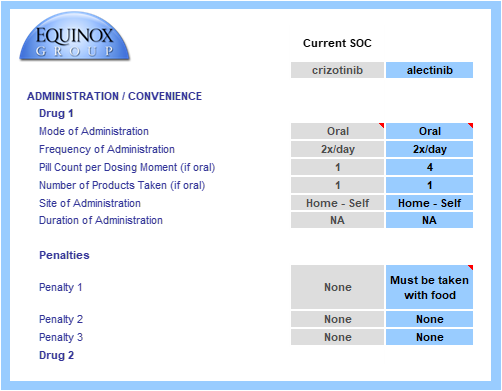
The drug or regimen’s convenience score is calculated via a consistent method. Common dosing methods, frequencies, and locations are pre-populated in drop-down menus. The model allows for multi-drug regimens to be modeled, even when combining IV and oral therapies. In this example, each profiled drug is an oral monotherapy.
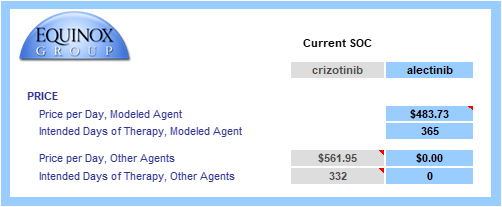
Finally, the drug or regimen’s annual cost is calculated using U.S. WAC pricing. We use WAC values because they allow fair, transparent comparisons and because net prices are not widely visible.
When patients are on treatment for less than one year, the cost calculation is restricted to time on treatment. In the example below, median time to progression is 10.9 months, so only that fraction of the year is entered in “intended days of therapy”.
The Unmet Need Sheet
The data from the Clinical sheet flow into the Unmet Need sheet (see below); the core clinical assumptions each have their own sub-domain under product need.
Equinox Group staff gather peer-reviewed data on disease burden (disease seriousness and disease cost), and the consistent utility functions are applied in Excel.
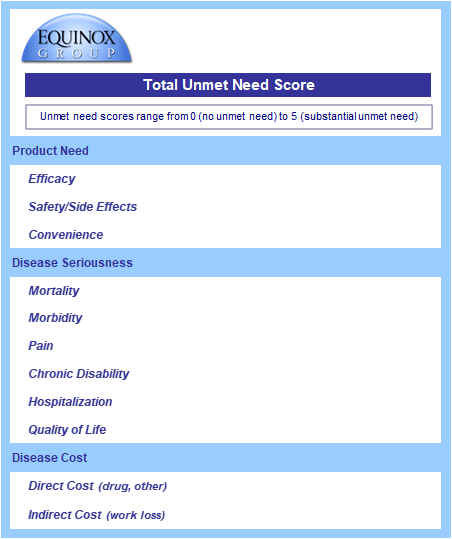
Baseline disease seriousness and costs values come from relevant academic literature, and improvements in efficacy flow through to reduce need in these domains.

In this example, alectinib is more efficacious (thus the lower Efficacy score) and has a cleaner side effect profile than crizotinib. Despite a minor convenience disadvantage, its product need score is significantly lower.
The advantage in overall survival is reflected in a lower mortality score.
Advantages in progression-free survival and response rates reduce morbidity, indirect costs, and non-drug direct costs.
These benefits in indirect and non-drug direct costs partially offset alectinib’s higher price.
The weighted sum of these domain-specific unmet need scores equals a product’s total unmet need score. Overall, total unmet need is lower with alectinib than with crizotinib in 1L ALK+ NSCLC, indicating a better therapeutic option.
Drivers of Innovation
We call the reduction in total unmet medical need is called "Clinical Innovation". We graphically display Clinical Innovation using a Drivers chart.
The gold bars to the left and right of the chart represent the unmet need score under the SOC (crizotinib) and entrant (alectinib), respectively. Scores range from 0-5 with 0 representing no unmet need. As with any waterfall chart, the intermediate green and red bars represent improvements and detriments, respectively, in domain-specific unmet need.

In the above figure, alectinib is shown to reduce total unmet medical need by 23.2%, with more than two-thirds of its improvement coming from efficacy advantages, and its direct cost impact clawing back <1% of its Clinical Innovation. (The percentages on the chart show the contribution of each domain to that 23.2% overall improvement.)
The Clinical Innovation score of 23.2% is highly impressive. Recall our rules of thumb: products with unmet need improvements of >2% are typically commercially viable, >5% are commercially successful (top 3-4 in market), and >10% are market dominators.
The Competitive Environment
Equinox conducts a thorough review of the developmental pipeline using publicly available sources, such as clinicaltrials.gov and sponsor websites. This pipeline is reviewed by physician experts to ensure nothing is missed, and client competitive intelligence is welcomed.

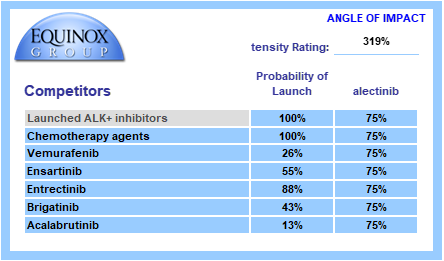
Each pipeline agent is assigned a probability of launch based upon its phase of development and recent data on success probability by phase and therapeutic area. Competitors are also assigned an angle of impact – how directly (25%-100%) will the entrant and the pipeline agent compete with each other?
We call the sum product of these factors “Competitive Intensity”, a probabilized headcount of competitors the entrant will face at launch. A competitive intensity rating of 319%, as shown below, is roughly comparable to three direct competitors at launch.
The Commercial Sheet
Seeing a profile’s projected peak-year share is as simple as one click. Selecting the SOC at launch in the blue cell will automatically update the profile’s clinical innovation score which, alongside competitive intensity, are entered into the Equinox Share Predictor. The Commercial sheet also displays key figures such as unmet need scores with the SOC and entrant, diagnosed prevalence of the indication in the U.S., and the annual cost of the profile.
Given a Clinical Innovation score of 23.2% and a competitive intensity rating of 319%, Equinox Group’s regression-validated algorithm projects a peak-year patient share of 60% for alectinib in 1L ALK+ NSCLC.

Each entrant’s share call compares its unmet need score to that of a chosen SOC and factors in the estimated number of competitors at launch. In this example, product attributes for potential new competitors are not evaluated in calculating peak share. As a further product offering, Equinox builds forecasts that capture the impact of competing entrants’ clinical attributes and launch timing to produce realistic forecasts of share over time.
Conclusion
The easy-to-use Excel-based DTA model allows clients to war-game scenarios for input values that aren’t certain yet (such as mature overall survival data) and instantly see how those alternatives affect Clinical Innovation and patient share estimates.
Interested in learning more? Click here to send us a message or to schedule a meeting with one of our practice leaders.
Equinox Group’s proven method to measure clinical innovation and peak-year patient share for new products is accurate, less expensive, more flexible, and quicker to execute than conventional market research-based techniques. We use this approach to inform decisions about individual programs (pipeline and business development), to help therapeutic area teams set aspirations, and to inform R&D portfolio assessments.
A project of this nature typically delivers results in around 6 weeks. We support our models for 24 months from kickoff and can help socialize the methodology and results within your organization.
About Equinox Group
Since 1995, Equinox Group has provided analytics to support R&D decisions at biopharmaceutical firms, assessing the potential of drugs from discovery to launch. Our validated techniques save time and money—and they overcome several deficiencies of traditional demand studies.
We have evaluated thousands of drug profiles across hundreds of indications in oncology, immunology, rare diseases, cardio-metabolic disorders, infectious disease, neurology, pulmonology, urology, ophthalmology, and endocrine disorders. We also have tailored methods to solve the unique analytical challenges that arise in oncology and rare diseases.
Using this methodology, we have developed a suite of tools to inform whatever R&D decisions you’re facing in any stage of development, including: setting indication priorities, supporting go/no-go decisions, assessing market access and pricing potential, share forecasting, and patient flow modeling.