

The Problem with Primary Market Research
Pharmaceutical companies spend millions on primary market research (PMR) every year — and often walk away with the wrong answer. PMR plays a genuine role in the R&D process: interviews with physicians provide insight into treatment paradigms, patient types and “journeys,” and reasonable expectations for the future of a disease. Equinox Group routinely conducts such interviews to inform our modeling efforts. This type of research has been a staple in the industry for decades, making it something people at all levels of organizations understand and can use to extract actionable insights. So, what’s the problem?
Too often, PMR is asked to be something it is not: a replacement for rigorous techniques that can quantify the advantage of a particular drug over another and communicate how that advantage actually translates to patient share potential. Below, we examine the specific instances where PMR comes up short and explain the approaches we take at Equinox Group to overcome these deficiencies.
1. Primary market research is not dynamic
Given that PMR consists of semi-quantitative interviews, much of the content of these interviews is only applicable so long as important details such as the treatment paradigm, current clinical data, and competitive pipeline remain unchanged. For example, if new post-approval data that come out show a drug to be a much greater improvement over the standard of care than previously thought, such as in the case of Kisqali in HER2-, HR+ 1st line breast cancer, any PMR done involving the current treatment paradigm and efficacy in this population prior to the new data being read out would immediately become outdated and of little use to development teams. So, if a company wants new insights into the potential of their drug in the market, they have no choice but to commit more time and money to additional PMR.
At Equinox Group, we handle this problem by creating dynamic, data-driven models that can instantly deliver new outputs with a few clicks of a button. Any clinical data, launch date, competitor, or price of an agent can be updated in our models as soon as that new information is available, resulting in a new patient share prediction for your agent.
Consider the Kisqali example. At launch, Kisqali showed a mere 0.5% improvement over Ibrance — barely enough to move the needle — and initial sales reflected that.
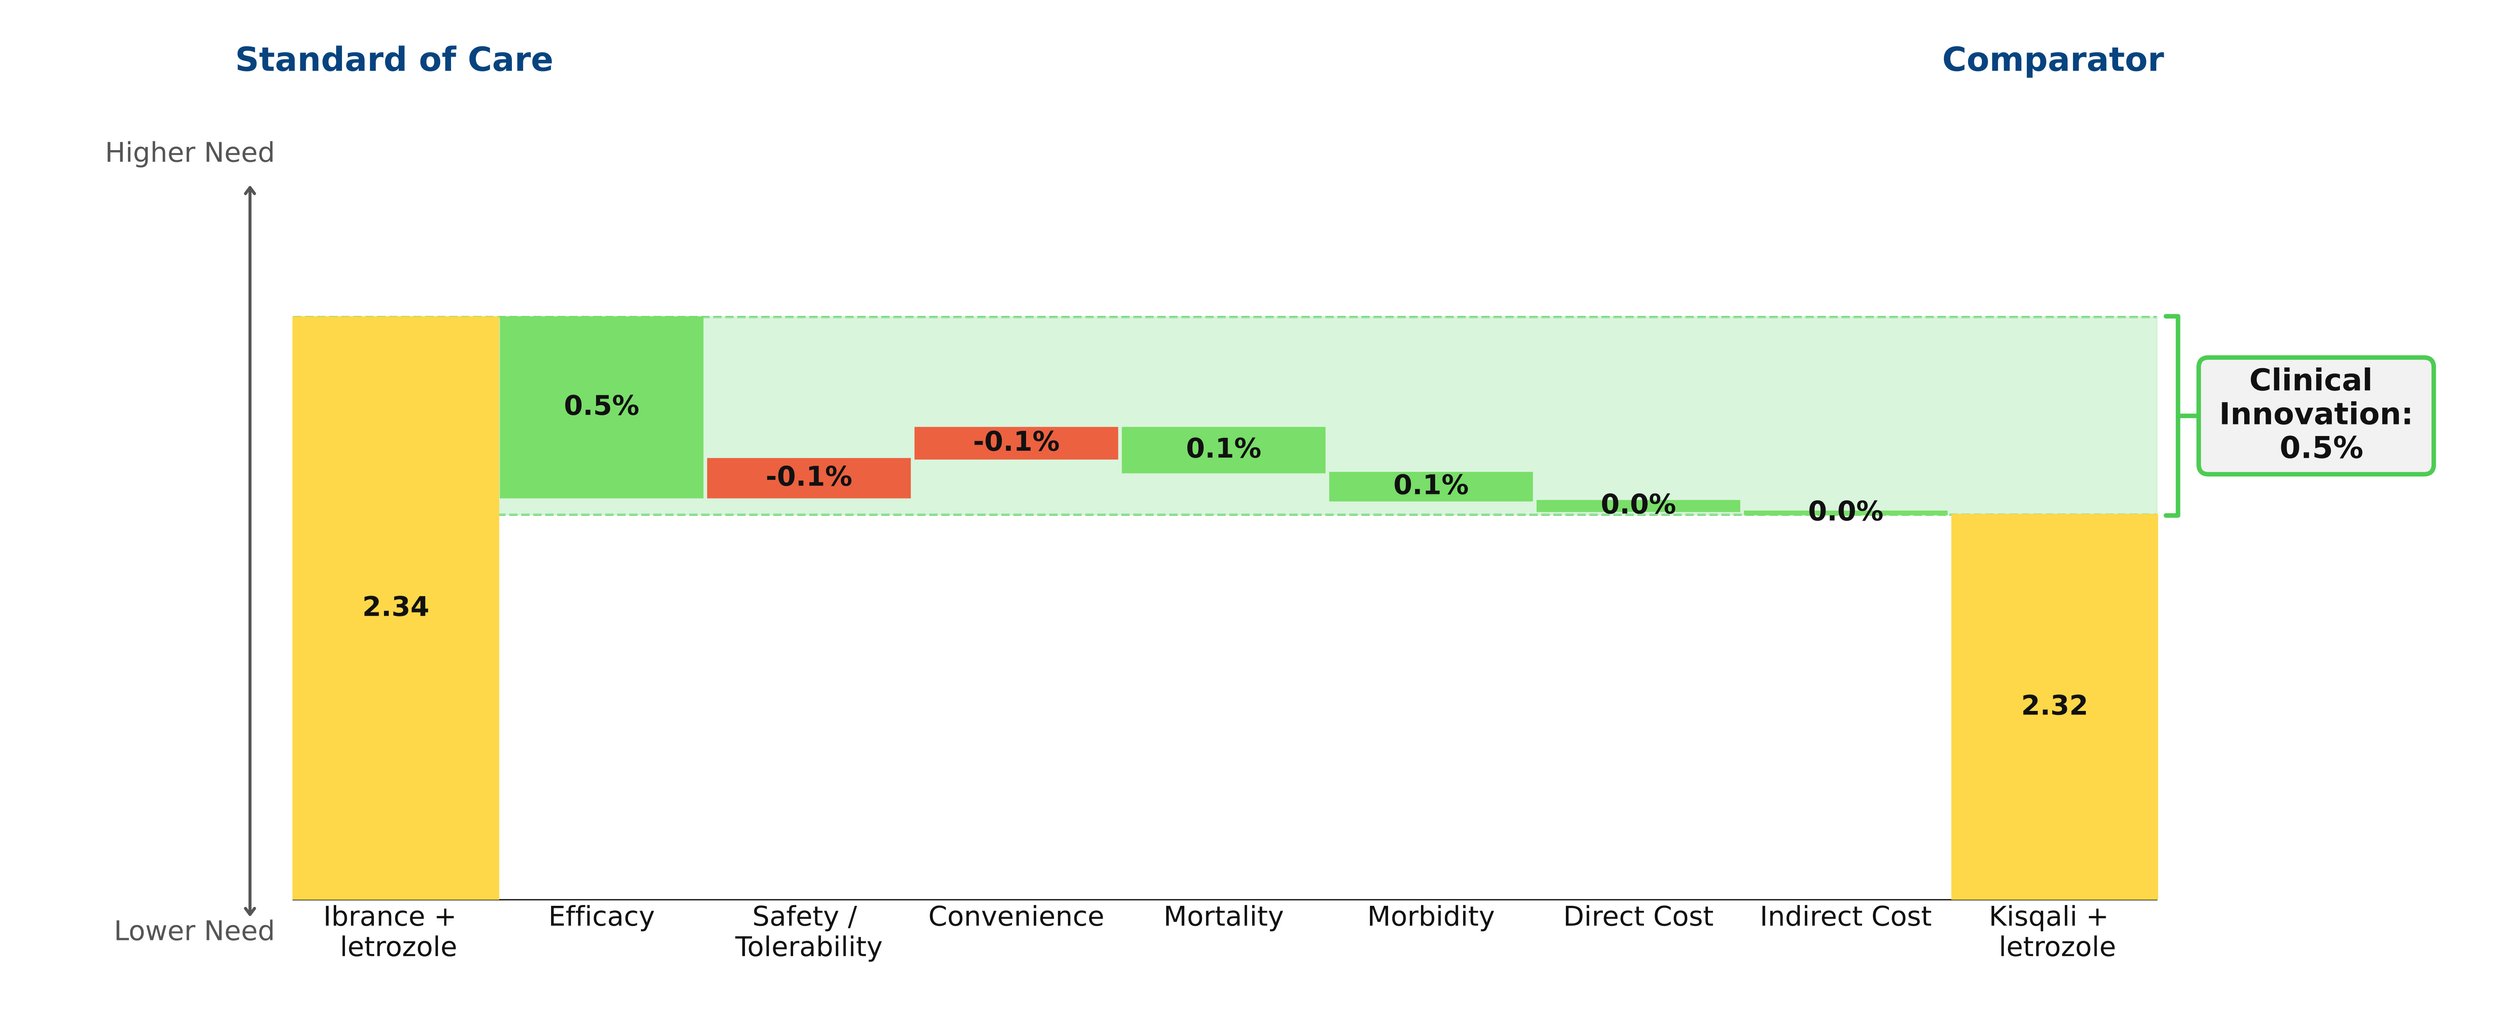
Figure 1: Kisqali at launch
However, years later Ibrance was found to have disappointing survival data, proving it to have been far less efficacious than previously thought. A slight improvement in efficacy for Kisqali was also shown over this period. As a result, Kisqali actually proved to be far superior to Ibrance and that was reflected in the patient share that it ended up receiving.
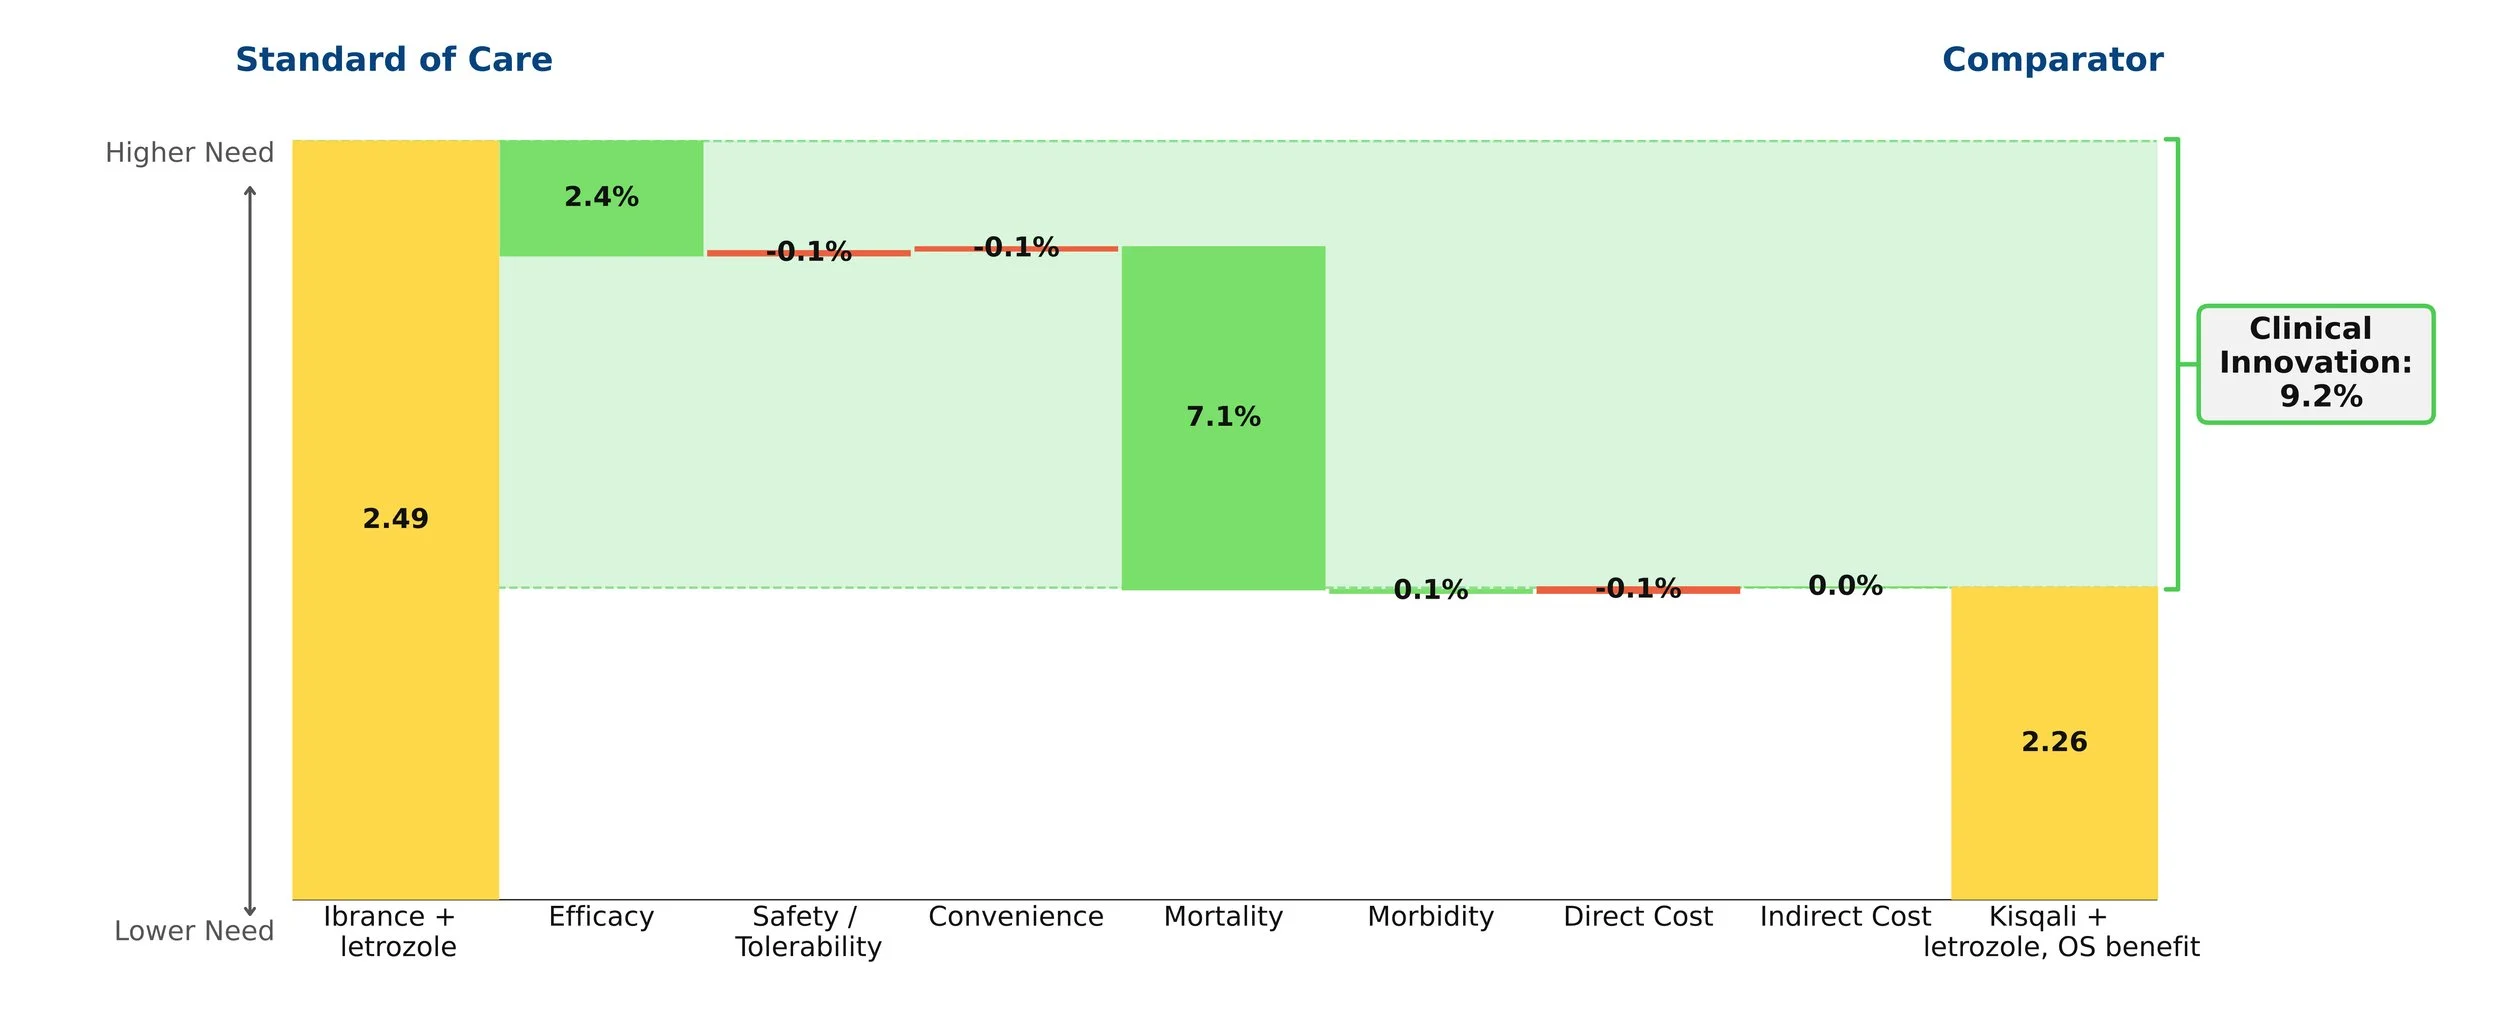
Figure 2: Kisqali update
In our model, this shift was captured instantaneously by updating a handful of numbers — a process that took seconds, not months at no additional cost.
2. Primary market research is not unbiased empirical data
As noted above, PMR is effective in obtaining insights from physicians regarding a variety of topics. However, these insights remain opinions — capable of being influenced by personal biases — and do not reach the level of objectivity of empirical clinical evidence. This is especially true in longer interviews, where respondents become fatigued and the quality of their answers deteriorates. Framing effects compound this problem: the way an interview is structured can meaningfully shift the responses given. While exercises such as conjoint analysis can yield a rough estimate of how one additional month of mPFS or a cleaner side effect profile affects commercial success, this method is not optimal.
As a core principle, the qualitative should only be used to predict the qualitative, while the quantitative should predict the quantitative. Results from PMR can suggest whether a drug will obtain “significant” share and dominate the market, but they cannot reliably pinpoint what that share would be.
By looking at historical drug launches and quantifying the effect of the clinical innovation of a drug on its patient share potential, we have a way of discovering the impact of these factors on commercial outcomes strictly based on peer-reviewed clinical data without the need for any guesswork or opinion.
3. Preference share ≠ patient share
While the outcomes of conjoint analyses are not without their uses, at times they are misinterpreted. Perhaps the most important of these outcomes is preference share – an estimate of the percent of physician’s that would choose a given TPP among the profiles of all relevant drugs in the market. Assuming that the interviews are conducted in a way that minimizes bias, the insights gained regarding the relative strengths of TPPs are actually of great value. However, they cannot be used as a proxy for patient share. This is in large part due to the fact that these interviews are incapable of capturing the intricate market dynamics that contribute to a drug’s share. Furthermore, the TPPs that are being assessed lack the necessary detail and often do not consider important factors such as order of entry or price. Therefore, just because we can obtain an estimate for what percent of prescribers favor TPP A over TPP B, it does not necessarily mean that we can know what share either of these agents will obtain. It is also important to note that the subjects of these interviews are, at times, not a nationally representative sample of prescribers.
We avoid these issues by deriving our patient share projections from a consistent, analytical framework that weights clinical innovation (which includes price), order of entry, and competitive environment according to the results of our extensive work with historical drug launches.
4. Primary market research is expensive and labor intensive
Finally, PMR projects often take months and impose large costs upon biopharmaceutical companies. As mentioned above, these costs may compound as new information makes additional research necessary.
In comparison, Equinox Group’s models can be completed in as little as 6 weeks and include two years of after-sales service from the project start date. Because our models are driven by published clinical data rather than primary fieldwork, they can be updated in real time by the client as new information becomes available — without incurring additional research costs every time the market shifts.
If you’d like to see more about this framework, we’d be glad to walk you through a live example. Feel free to schedule a meeting.
Since 1995, Equinox Group has provided analytics to support R&D decisions at biopharmaceutical firms, assessing the potential of drugs from discovery to launch, and anywhere in between. Equinox Group specializes in predicting the commercial performance of drug programs in all stages of research and development, delivering quantitative insights regarding:
Disease Area Strategy
Business Development Decisions
Market Access
Patient Share Forecasting
Epidemiology and Patient Flow

Plan for the Best, Prepare for the Worst - Handling Uncertainty in R&D
Where the Uncertainty Lies
Assets in mid to late-stage development are seldom immune to uncertainty surrounding their efficacy and safety profiles as well as that of their competitors. When considering these variables along with launch timing and the potential for reimbursement friction, traditional techniques such as conjoint analysis are rendered ineffective. Such circumstances require far more objective, dynamic, and future-proofed approaches.
A Data-Driven Approach
Using our unmet need framework, Equinox Group consistently quantifies the clinical improvement offered by a drug using a metric that we call Clinical Innovation. This measure has proven to be highly predictive of peak-year patient share and has been the basis of our analyses for over 30 years.
By objectively quantifying the Clinical Innovation of a new drug and all of its relevant competitors, we enable our clients to prepare for all possible scenarios that they will face during development and to seamlessly toggle between them.
Wargaming with Multiple TPPs
By quantifying the uncertainty in a given indication, we can understand its implications with remarkable accuracy.
Consider, for example, a chronic disease with three agents currently in the market. Working alongside the client, we come up with a base case, an upside case, and a downside case for their new drug, taking into account efficacy, safety, side effects, dosing, administration, price, and launch timing. Under the base case, the new drug achieves 20.3% share of drug-treated patients by the end of 2031. Under the upside and downside cases, it achieves 29.3% and 14.7% respectively. As a result, in a world where no competitors are launching in the coming years, we have bounded the share potential between 14.7% and 29.3%. By assigning probabilities to each of the three scenarios, a simple weighted average will yield the expected share by the end of 2031 under the assumed conditions. In this example the modeled probabilities of the base, upside, and downside cases are 71%, 21%, and 8%. This results in an expected value of 21.7% patient-share by 2031.
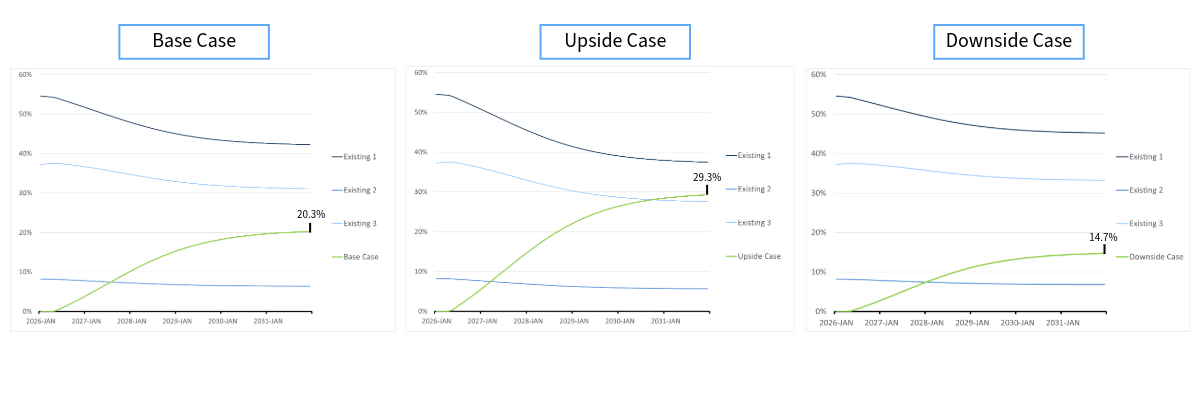
Figure 1: Launching without a threat
Introducing Competitors
By studying the different scenarios in Figure 1, it is clear that the client agent has moderate potential. Now, consider a highly innovative competitor, which we call Threat 1. With Threat 1 launching one year later than the client agent, it will have considerable, yet diminished, impact on the terminal shares. Now, the client agent 10.4% patient-share in the base case and 19.0% and 6.1% in the upside and downside cases respectively.
Using the same probabilities of 71%, 21%, and 8%, we get an expected value of 11.9% patient-share by 2031. These probabilities can be informed by input of the client organization and approximated through Monte Carlo simulations, which are easily implemented into our framework when handling uncertainty around all relevant product attributes including launch timing.
Analyses like this can be made as complex as needed, allowing for up to 15 different drug profiles, characterizing the variety of potential attributes of your drug as well as all relevant competitors.
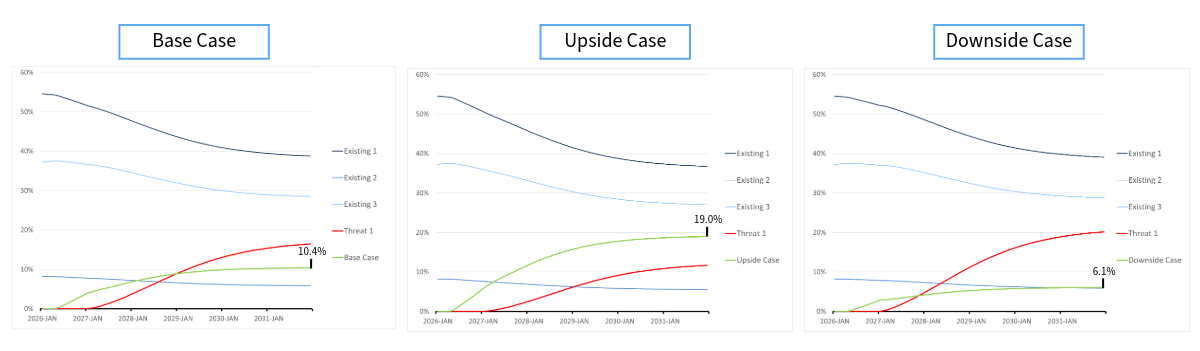
Figure 2: Launching with a threat
What About When the Data Changes?
Whether it be new clinical data pertaining to your agent or any of its competitors, the dynamic nature of these models allows client organizations to change the relevant inputs within a matter of minutes with no additional cost. That means no need for funding 50 additional interviews with leading physician’s, no need for creating new stimuli, no guesswork, and no time wasted in order to obtain new patient-share estimates.
Equinox Group has fine-tuned these methodologies and others over the past 30 years to help biopharmaceutical companies handle challenges in R&D. Our specialties range from disease-area strategy and market access to patient share forecasting and patient flow modeling.
To learn more about our process, click here to schedule a meeting with one of our practice leaders.

Finding the Best R&D Opportunities
R&D leaders making investment decisions must rely on opportunity assessments from program advocates. Equinox Group offers independent analyses that allow decision makers to add an objective perspective to these discussions, leading to a fact-based conversation about the clinical and commercial merit of the various projects competing for R&D resources.
“But I don’t have TPPs, what can I do?”
We spend much of our time talking with clients about how good their TPPs look and what patient shares they can expect to achieve in order to guide indication prioritization. To read a case-study on how we do this, click here.
But what can we do for you if you don’t have TPPs yet?
The answer is a two-step process, which we call Disease Area Scan. First, we characterize the unmet medical need, epidemiology, and competitive intensity in all of the populations of interest. This allows for cross-indication comparisons that help identify which opportunities offer the greatest potential for commercial success. Next, we examine each of those opportunities individually, discovering what level of improvement is required in specific product attributes in order to achieve a certain level of Clinical Innovation and peak-year patient share. These analyses are grounded in peer-reviewed literature and hard clinical data, removing subjectivity and opinions from the equation.
Step 1: Characterizing unmet medical need, epidemiology, and competitive intensity
We begin our modeling process by diving into the most recent peer-reviewed literature pertaining to each indication, quantifying the level of unmet need under the current standard of care. See Figure 1 for a detailed breakdown of what we measure.
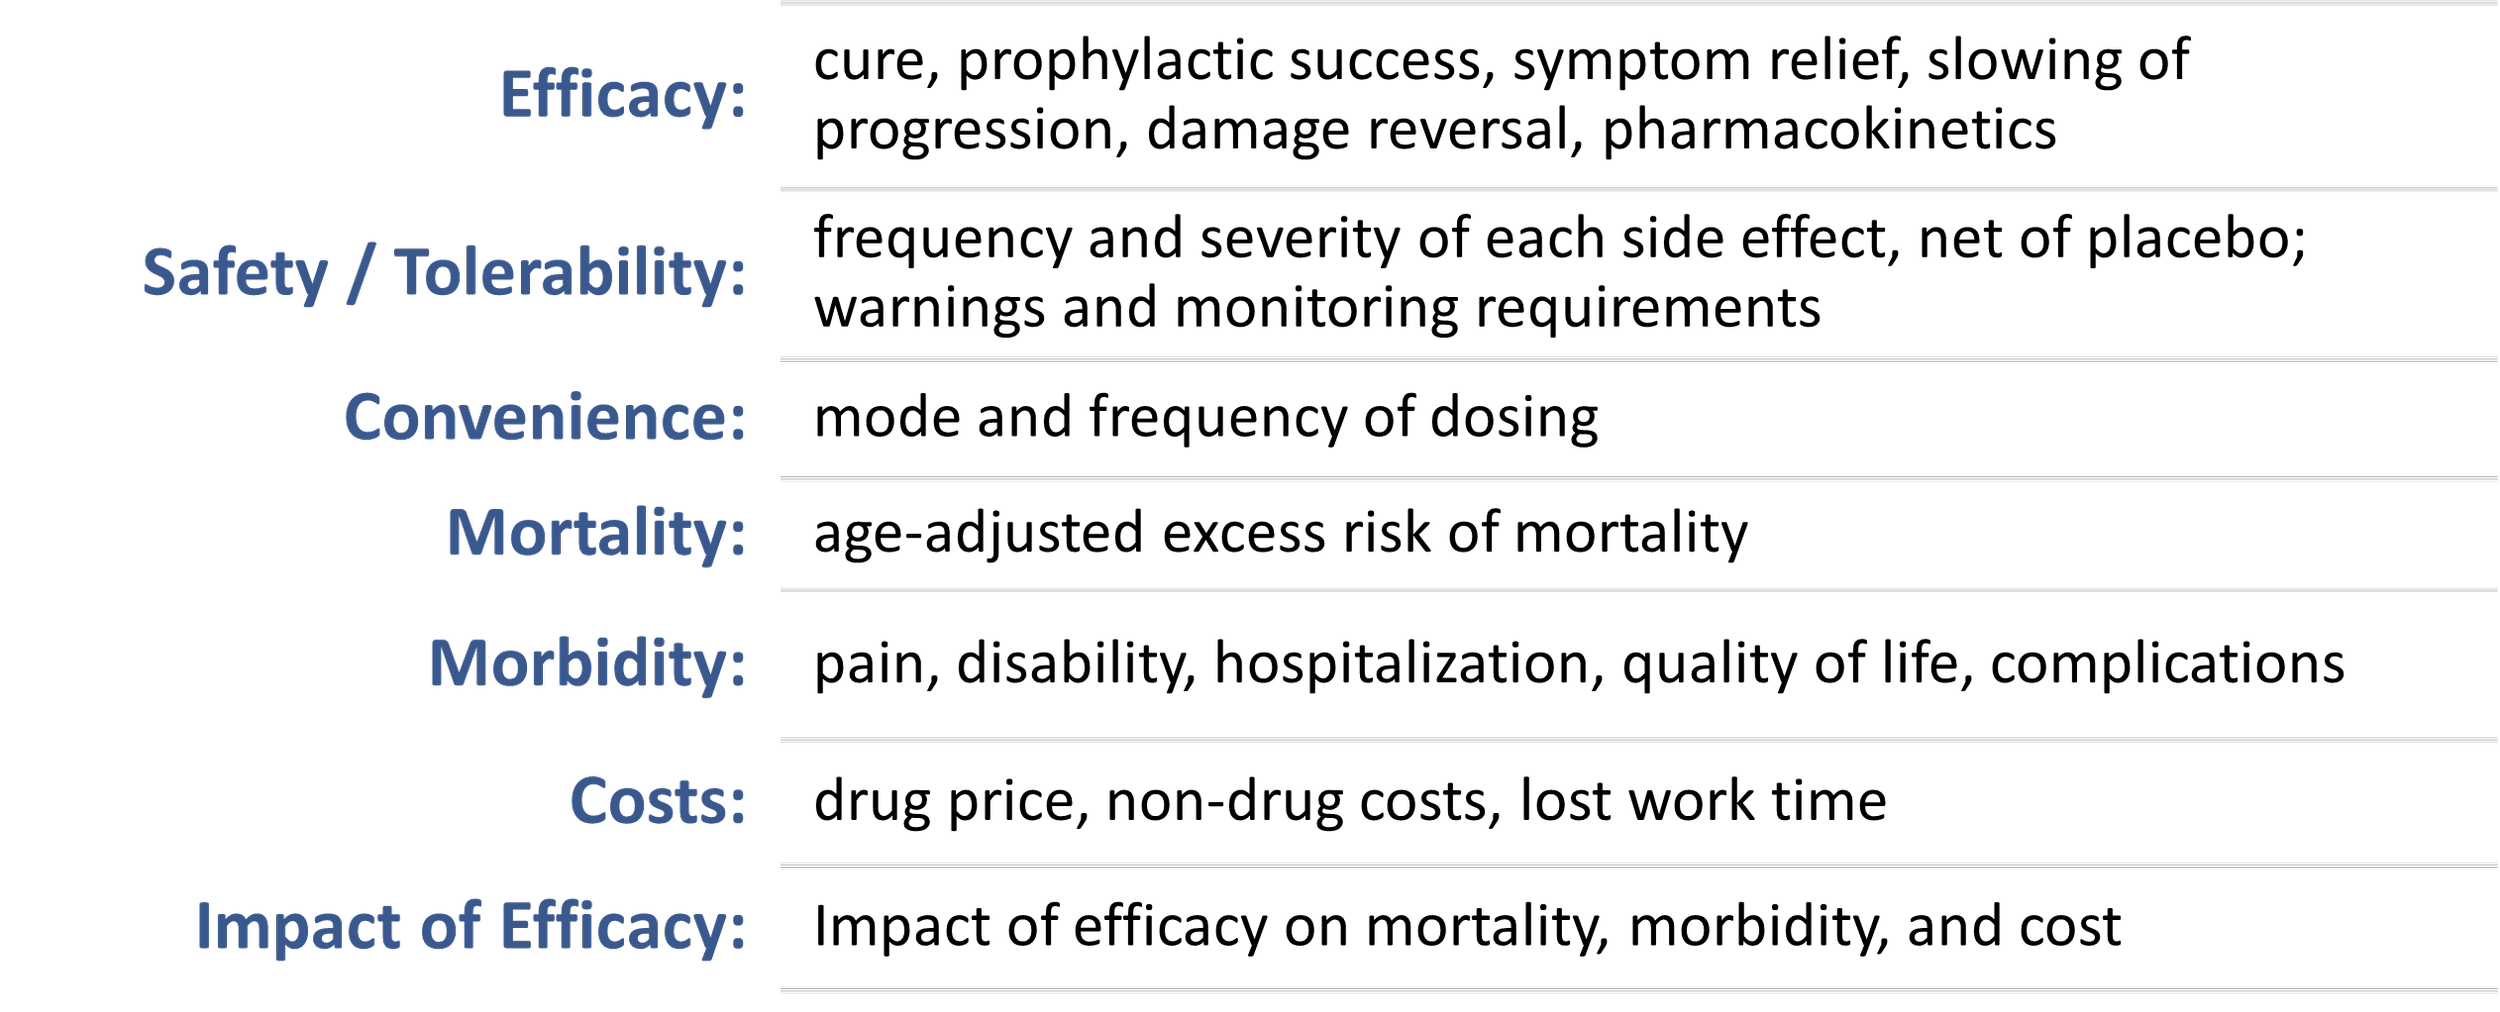
Figure 1: Factors we assess
These measures are then mapped onto a 0 to 5 scale to produce a single “unmet need score,” with a higher score indicating a higher level of unmet medical need.
Next, we align with the client organization on the epidemiology and competitive pipelines in each indication. We represent the latter by a probability weighted score indicating the expected number of head-to-head competitors that a drug will face at launch. We call this the “competitive intensity.”
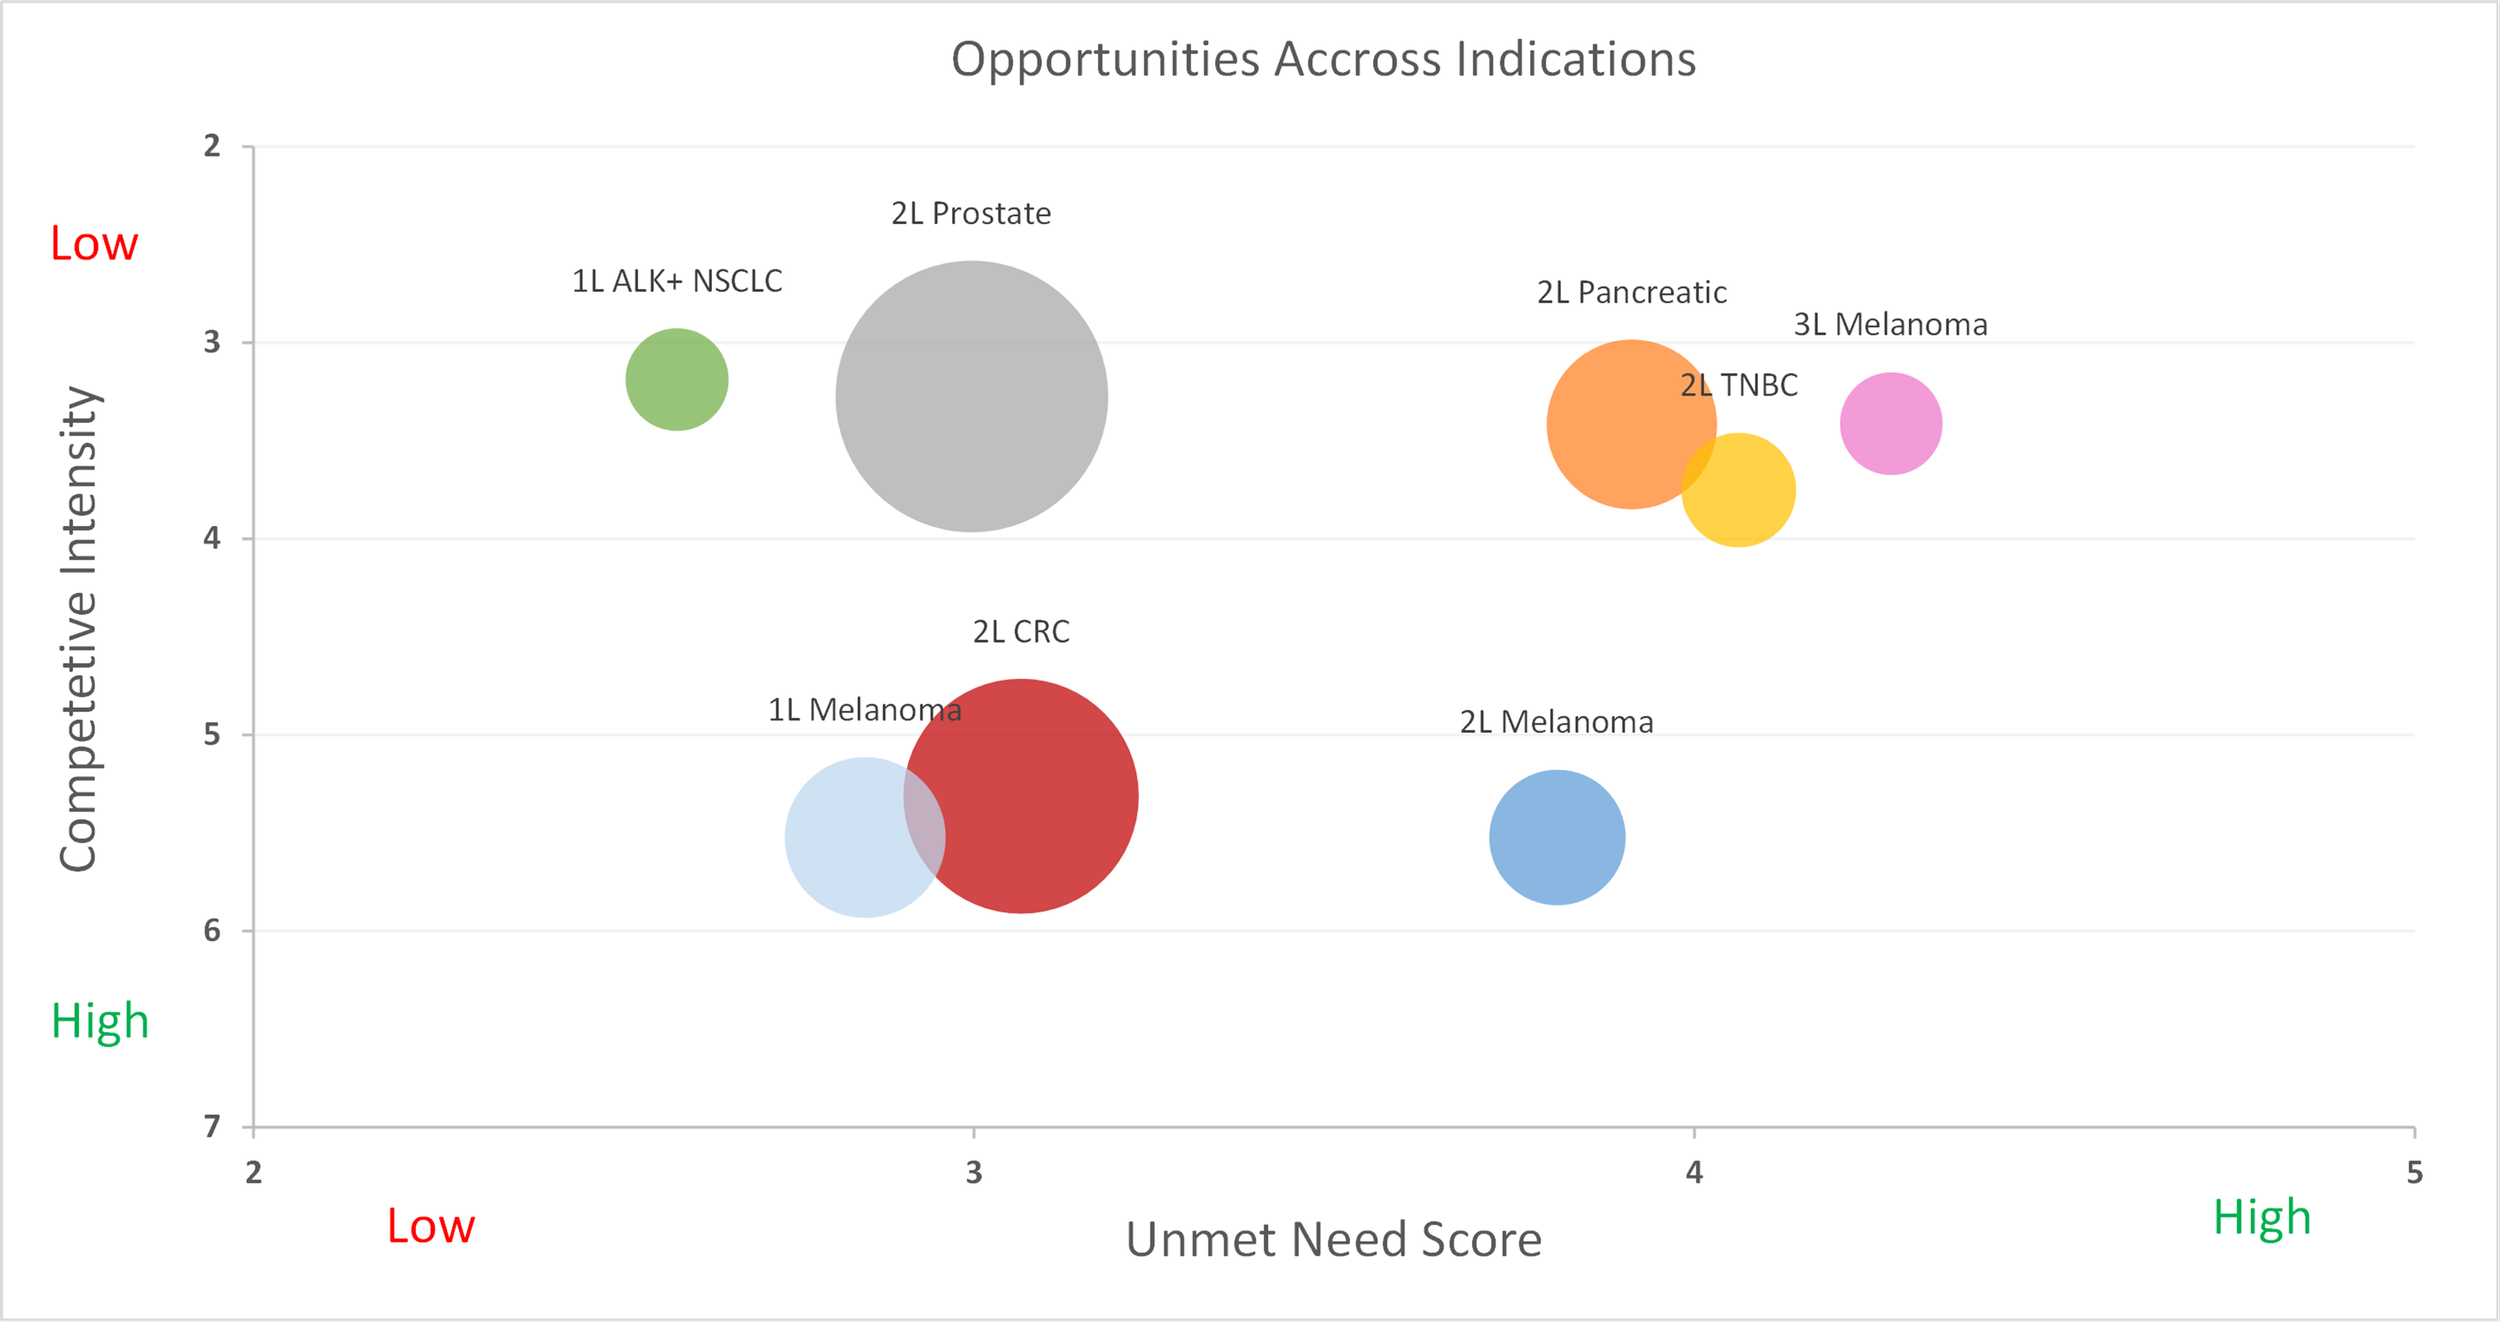
Figure 2: Competitive intensity vs. unmet medical need
Looking at Figure 2, we can identify the most attractive opportunities, which are those with sizeable populations, considerable unmet need, and relatively low competition. Granted, two questions still remain. First, how would the specific drug need to perform in these populations in order to be successful? Second, in what indications do you realistically believe that you can achieve that performance?
Step 2: Using Heat Maps
In order to answer these questions, we can turn to a series of heatmaps, which guide development teams in understanding what levels of Clinical Innovation are achieved by specific efficacy and side effect profiles. Below in Figure 3, we will explore a situation where the current standard of care is pembrolizumab with a median progression-free survival of 6.9 months. We see that an improvement of 1 month in mPFS and a similar side effect profile will result in a 4.6% Clinical Innovation, which is slightly below the recommended 5% threshold. However, if the new drug also offered a side effect profile similar to that of crizotinib, it will achieve a 5.8% Clinical Innovation and likely have a favorable commercial outlook. (For this analysis, it was assumed that an improvement of one month in mPFS also led to an improvement of two months in mOS)
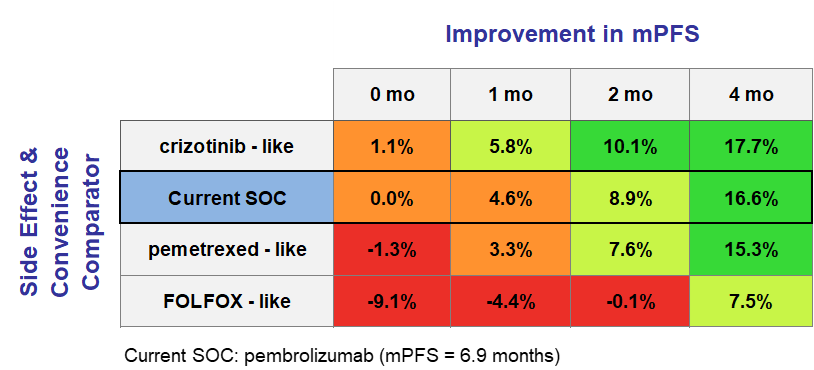
Figure 3: An introduction to heat maps
By focusing on relative improvements under the Equinox framework, development teams are able to identify indications where their agent has the potential to be competitive (those where Clinical Innovation 5-10%) and those where it could be a homerun (Clinical Innovation >10%). In situations where the clinical team is not ready to commit to specific efficacy values for their TPPs, this approach allows teams to prioritize those indications where they are more confident of “getting into the green”. These heat maps can be generated for a variety of attributes, allowing for a comprehensive and thorough analysis of potential products that projects a variety of scenarios.
What About Share Potential?
While Clinical Innovation is a powerful predictor in itself, we don’t have to stop there. Combining the clinical innovation scores of hypothetical TPPs along with the corresponding competitive environment, unmet need, and epidemiology allows for the preliminary estimation of peak-year patient share using our Disease Target Assessment (DTA) framework. Given its dynamic nature, it is easy to conduct “what if” analyses with a variety of TPPs in each indication. Additionally, once TPPs are finalized, they are easily input into the model and adapted to continue to guide the R&D process. To read more about what is behind our analysis and how it predicts share, watch this quick video.
Equinox Group has fine-tuned these methodologies and others over the past 30 years to help biopharmaceutical companies handle challenges in R&D. Our specialties range from market access and go/no-go decisions to patient share forecasting and patient flow modeling.
To learn more about our process, click here to schedule a meeting with one of our practice leaders.